EngageNY
Comparison of Numbers Written in Scientific Notation and Interpreting Scientific Notation Using Technology
Examine numbers in scientific notation as a comparison of size. The 14th lesson in the series asks learners to rewrite numbers as the same power of 10 in scientific notation to make comparisons. Pupils also learn how to use a calculator...
Curated OER
My Foot and the Standard Foot
Young mathematicians put one foot in front of the other as they learn how to measure length in an elementary math lesson. Using paper cutouts of their own feet, children measure classroom objects as they discover the importance of...
Statistics Education Web
Saga of Survival (Using Data about Donner Party to Illustrate Descriptive Statistics)
What did gender have to do with the survival rates of the Donner Party? Using comparative box plots, classes compare the ages of the survivors and nonsurvivors. Using the same method, individuals make conclusions about the...
Curated OER
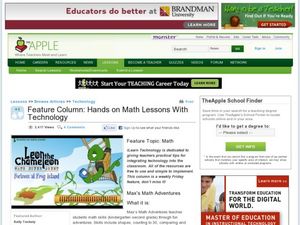
Feature column: Hands on Math With Technology
Young learners will view a math adventures video and practice math concepts. Afterwards they will navigate through Internet sites to participate in teacher selected math adventures. This guide walks you through integrating...
Curated OER
Using Technology to Represent Mathematical Identities
Students explore the concept of trig identities. In this trig identity lesson, students use Mathematica to graph trig identities. Students see the trig identities graphically and enforce the notion that two trig functions can be equivalent.
EngageNY
Modeling Riverbeds with Polynomials (part 2)
Examine the power of technology while modeling with polynomial functions. Using the website wolfram alpha, learners develop a polynomial function to model the shape of a riverbed. Ultimately, they determine the flow rate through the river.
Intel
Choreographing Math
Leaners investigate families of linear functions through dance. They choreograph dance moves to model nine unique linear functions of their choosing. Using their dance moves, teams create a video presentation complete with music and...
Curated OER
Solar Kit Lesson # 12 - Calibration Curve for a Radiation Meter
Scientists need to have mastered algebraic slope-intercept concepts in order for this lesson to be effective. They will measure and graph solar panel output as a function of the amount of radiation striking it, discovering that there is...
02 x 02 Worksheets
Inverse Variation
Discover an inverse variation pattern. A simple lesson plan design allows learners to explore a nonlinear pattern. Scholars analyze a distance, speed, and time relationship through tables and graphs. Eventually, they write an equation to...
Virginia Department of Education
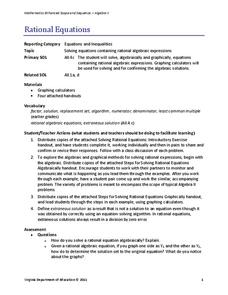
Rational Equations
Provide guidance and practice of the useful skill: solving rational equations using both an algebraic and graphical approach. Pupils solve increasingly more difficult rational equations using algebraic methods. After, they...
Mathematics Vision Project
Module 2: Logarithmic Functions
Build a solid understanding of logarithmic functions and equations. Five lessons in the module begin by developing the concept of a logarithm. The next lessons address graphing logarithmic functions, logarithmic properties, and solving...
Concord Consortium
Here Comes the Sun
Many phenomena in life are periodic in nature. A task-based lesson asks scholars to explore one of these phenomena. They collect data showing the sunrise time of a specific location over the period of a year. Using the data, they create...
Curated OER
Square Roots Using a Carpenter's Square
Students calculate the square root of a given number using carpenter's square measurements. In this math lesson, students relate this method on the Pythagorean theorem. They answer practice problems after the exploration activity,
EngageNY
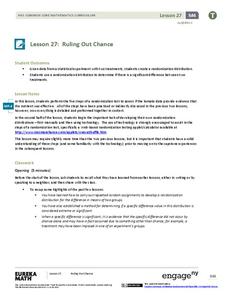
Ruling Out Chance (part 3)
Pupils analyze group data to identify significant differences. They use simulation to create their own random assignment data for comparison.
EngageNY
Composition of Linear Transformations 2
Scholars take transformations from the second to the third dimension as they extend their thinking of transformations to include three-dimensional figures. They explore how to use matrices to represent compositions of...
Curated OER
Yummy Math
Young mathematicians use bags of Skittles to help them gain practice in graphing and organizing data. They work in pairs, and after they have counted and organized their Skittles, they access a computer program which allows them to print...
EngageNY
Sampling Variability in the Sample Mean (part 1)
How accurate is data collected from a sample? Learners answer this question using a simulation to model data collected from a sample population. They analyze the data to understand the variability in the results.
Statistics Education Web
NFL Quarterback Salaries
Use statistics to decide if NFL quarterbacks earn their salaries! Learners study correlation coefficients after using technology to calculate regression equations. Through the data, they learn the meaning of correlation and correlation...
Statistics Education Web
Text Messaging is Time Consuming! What Gives?
The more you text, the less you study. Have classes test this hypothesis or another question related to text messages. Using real data, learners use technology to create a scatter plot and calculate a regression line. They create a dot...
CK-12 Foundation
When to Use the Distributive Property: Rational Expressions
Discover how the distributive property applies to division. As learners change numeric values within an expression, the simulation calculates its value. Challenge questions lead individuals to realize the power of distributing the...
California Mathematics Project
Meteorology
See how estimation is essential to making temperature weather maps. Scholars use ratios and rates of change to estimate temperatures at locations where temperature readings have not been made. They connect this idea to linear functions.
Curated OER
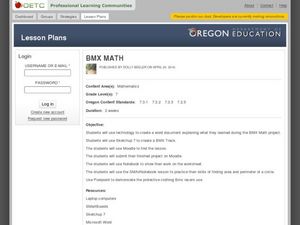
BMX Math
Students investigate circles using a BMX path. In this circles lesson, students use technology of various kinds to create a BMX track. They use Moodle to develop their lesson and as they investigate the area and perimeter of a circle....
EngageNY
Making Fair Decisions
Life's not fair, but decisions can be. The 17th installment of a 21-part module teaches learners about fair decisions. They use simulations to develop strategies to make fair decisions.
Utah Education Network (UEN)
Linear Graphs Using Proportions and Rates
Using a TI-73 or other similar graphing calculator middle school math majors investigate the linear relationship of equivalent proportions. After a brief introduction by the teacher, class members participate in a timed pair share...


