Space Awareness
Valleys Deep and Mountains High
Sometimes the best view is from the farthest distance. Satellite imaging makes it possible to create altitude maps from far above the earth. A three-part activity has your young scientists play the role of the satellite and then use...
University of Richmond
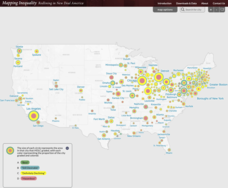
Mapping Inequality: Redlining in New Deal America 1935-1940
Redlining—or the practice of racial discrimination in housing loans—directly led to today's segregated living patterns in America. Using data from the federal Home Owners' Loan Corporation, classmates visualize the impact of policy on...
Curated OER
Water Conservation
Open learners' eyes to the challenge of finding safe drinking water – something we often take for granted in our country. The PowerPoint presentation includes images, graphs, diagrams, and even a video to stimulate discussion on how we...
Curated OER
The Mussels Are Coming
Students work together to identify and describe the various types of mussels. Using a color-coded system, they plot the arrival date of zebra mussels in North American waters. They discuss the increase in their population with the class.
Curated OER
What in Our World Affects the Way People Live
Sixth graders study various maps that show geographical features and population. They compare the maps and make inferences about how various geographical features influence the population and human activities of an area.
Curated OER
" Where in the World is Your Blood Type?
Students explore a map of the worldwide distribution of blood types and observe the patterns. In this blood type lesson students conduct a lab and determine the geographic distribution of the different blood types and determine a...
Curated OER
Sea Floor Spreading
Students discuss convection currents in the Earth's mantle, how they form, and how they move as well as the causes of earthquakes. Working in a group, they analyze a color coded World Earthquake Map and try to determine which direction...
Curated OER
Weather Patterns and Acid Rain (or What is Chicago's acid rain doing in the Adirondacks?)
Students examine a color-coded map of U.S. acid rain precipitation intensity. Using EPA data table and the blank U.S. map, they record state-by-state values for magnitude of emissions and compare areas of emissions to areas with the most...
Curated OER
Stratigraphy -- Layers of Time in the Earth
Students are introduced to the process of stratification. Using the internet, they read about the Richard Beene archeological site near San Antonio. Using a map, they color code the different layers present at this site and answer...
Curated OER
Genetics
Students create a checklist of traits common in all of their families. Uisng a table, they compare and contrast their family members to non-family members. They also review dominant and recessive traits and discuss how knowing about...
Curated OER
Anolis Lizards of the Greater Antilles
Students "take a trip" to the Greater Antilles to observethe Anolis lizards. They study the body structures and habitat of different species, then plot this data on a map to look for patterns in their distribution. From the patterns they...
Curated OER
Plotting Earthquakes
Learners explore earthquakes. Using the National Earthquake Information Center website, students plot daily earthquakes on a map. They observe the magnitude of each earthquake. Learners identify the pattern of earthquake locations and...
Curated OER
Pixel Transmission
Students develop code systems to transmit information between groups. They explore, explain and apply techniques used to transmit remote sensing data to better understand remote sensing images.
Curated OER
Virginia In the World: The Geography of Commerce
Students examine how Virginia connects with the world through export trade. Using a map, they use symbols to depict the value of trade and the direction of the flow of goods. They complete a scavenger hunt using electronic almanacs and...
Curated OER
Terrific Tastebuds
Students investigate the four taste regions of the tongue. In this biology lesson, students view a diagram of a tongue and identify the four regions. Students perform a taste test with lemons, sugar, and crackers.
Curated OER
Explore: 4th Grade Beaufort Wind Speed
Fourth graders measure wind speed, air pressure, humidity, temperature, and wind direction. They compare their observations with those of actual weather forecasts.


