Curated OER
Weather With a Latitude
Students read the temperature from a thermometer. For this weather lesson, students read a thermometer and record the temperature at twenty minute intervals. Students discuss results.
Curated OER
GPS Treasure Hunt
Students explore geography by participating in a treasure hunt activity. In this Global Positioning System lesson, students define the terms latitude and longitude while utilizing an electronic GPS device. Students view a PowerPoint...
Curated OER
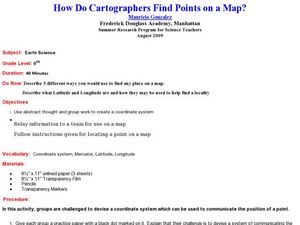
How Do Cartographers Find Points on a Map?
Ninth graders describe latitude and longitude and how they may be useful to find things on a map. In this cartography lesson students divide into groups and devise a coordinate system that can be used to communicate a position.
Curated OER
Celebrating the Solstice and Equinox
Fourth graders graph the number of daylight hors throughout the year and examine why day length varies. They discover that seasonal changes and latitude on Earth affect the number of hours of daylight in each day. Students listen to...
Curated OER
GPS Sports Field Activity
Students practice using GPS receivers and explore how knowing the coordinates of two locations allows them to determine the distance between those two points. They use the theory that they already had knowledge of and apply it to a...
Curated OER
Your Expedition of Discovery
Young scholars study GPS and see how it is used to determine points on the Earths surface. In this expedition lesson students use GPS to find given coordinates.
NOAA
Tracking a Drifter
Be shore to use this drifter resource. The third installment of a five-part series has learners using the NOAA's Adopt-a-Drifter website to track to movement of a drifter (buoy) in the ocean. Graphing the collected data on a map allows...
Curated OER
Rubber Duckies and Ocean Currents
Students explore marine life by conducting a rubber duck experiment. In this water currents lesson, students practice identifying latitude and longitude coordinates on a map and define the currents of major oceans. Students discuss the...
Curated OER
The Sounds of Samba
Students research the origins of Samba in Brazil using the internet. After defining new vocabulary, they locate the cities in Brazil using latitude and longitude which practice the Samba. In groups, they compare and contrast the...
Curated OER
Science: Hurricanes As Heat Engines
Learners conduct Internet research to track the path of Hurricane Rita. They record the sea surface temperature of the Gulf of Mexico during and after the hurricane and draw conclusions about how hurricanes extract heat energy from the...
Curated OER
Topographic Map Unit Plan
Students examine topographic maps and discover how to decipher contour intervals, use contour lines and apply information to complete a topographic map lab. Working in groups, they identify the scale of the map, latitude and longitude,...
Curated OER
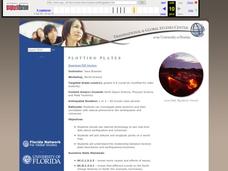
Plotting Plates
Students investigate plate tectonics and their correlation with natural phenomena like earthquakes and volcanoes. They use the internet to see real-time data about earthquakes and volcanoes. Students plot latitude and longitude points on...
Curated OER
Creating Climographs
Students use satellite data to compare precipitation and surface temperatures on different islands. In this satellite lesson students create graphs and explain the differences between weather and climate.
Curated OER
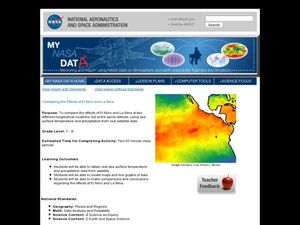
Comparing the Effects of El Nino and La Nina
Students examine the differences between an El Nino and La Nina year. In this investigative lesson students create maps and graphs of the data they obtained.
Curated OER
Solar Cell Energy Availability From Around the Country
Students determine areas that are the most likely to produce solar energy by using NASA data. In this solar energy lesson students analyze plots and determine solar panel use.
Curated OER
Sundials and Shadows - What Can They Teach Us About Seasons?
Students collect and analyze data relating to seasonal changes. They view a video, research web sites and build a sundial to collect their data.
Curated OER
Understanding Topographic Maps
Underclassmen create a cone-shaped landform and then draw a contour map for it. Then they examine a quadrangle (which was easily located with an online search), and relate it to what they experienced. The accompanying worksheet is...
Curated OER
Human Effect
Students investigate changes in air quality. In this science lesson, students compare data to determine the air quality. Students explore how humans affect the air quality.
Curated OER
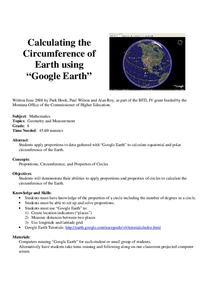
Calculation the Cricumference of Earth using "Google Earth"
Eighth graders investigate properties of circles. In this eight grade mathematics lesson, 8th graders apply proportional reasoning to data gathered with “Google Earth” to calculate equatorial and polar circumference of the...
Curated OER
Modeling Earthquake Data
Learners evalute evolutionary theories and processe of Geology. They examine evidence that the movement of continents has had signicicant global impact, major geological events. Students evaluate the forces which shape the lithosphere...
Curated OER
Navigation Across the Seas
Young scholars examine nautical navigation and discover the differences between nautical charts and other types of maps or charts. Students practice setting a course, taking a bearing, and dead reckoning. This gives young scholars an...
Curated OER
Typhoon Project
Students graph and outline the path of a typhoon. In this algebra lesson, students measure the path of the typhoon and create a graph with their data. They analyze the data and make predictions.
Curated OER
Seasonal Cloud Cover Variations
Students recognize different cloud types. They determine the seaonality of various types of clouds. They graph the data and determine if a correlation exists between season, cloud cover and type of clouds most prevalent during each season.
Curated OER
Animal Trackers
Learners use space technology to monitor migratory species, map their movements, and gather data about their habitats and possible responses to climatic shifts.


