101 Questions
CoinStar
Would you rather have a bowl of dimes or a bowl of quarters? A video introduces the problem by presenting two bowls, one full of quarters and another full of dimes. Learners use information from a CoinStar receipt to calculate the number...
Curated OER
Analyzing Graphs of Two Equations
Students analyze graphs of two equations. In this algebra lesson, students rewrite word problems as linear equations. They graph their solution and compare and contrast the two items being represented.
Curated OER
Exploring Quadratic Graphs
Students solve quadratic equations using graphs. In this algebra lesson plan, students factor quadratic equations and graph their answer. They discuss the shape of their graph based on the function.
Balanced Assessment
Alcohol Level
How long does it take alcohol to leave your system? Individuals explore this question by examining a polynomial function. They draw conclusions by analyzing the key features of the given polynomial function.
Curated OER
Find Parabolas through Two Points
Your learners will write quadratic functions whose graphs include specific points and explore how these graphs are related to each other.
Achieve
Rabbit Food
Keep your pets slim, trim, and healthy using mathematics! Pupils use a linear programming model to optimize the amount and type of food to provide to a pet rabbit. They model constraints by graphing inequalities and use them to analyze a...
Achieve
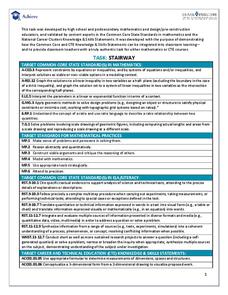
Stairway
It's the stairway to learning! Scholars research all aspects of building a staircase. Using information from building codes, they write and graph a system of inequalities to analyze the constraints. The completed project is a scale model...
Texas Instruments
TI-Nspire™ CAS
When it comes to rating educational calculators, this calculator is always near the top of this list. Now it's available as an app. There is a lot of calculator power wrapped up in this app. Not only is this a fully functioning...
Curated OER
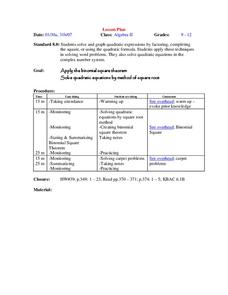
Quadratic Equations and Binomial Square Theorem
Learners factor quadratic equations. In this algebra lesson, students apply the binomial square theorem to solve quadratics. They complete the square and use the complex number system to solve for the roots.
Curated OER
Paying College Tuition
The investigation of exponential equation in the context of increasing college tuition costs is explored through this lessib. Students write exponential equations based on the percent of change of college tuition and use their equations...
Curated OER
Functions and the Vertical Line Test
Students examine functions and function notation. They use computer activities to discover how to graph functions, and conduct a vertical line test. Students describe spatial relationships using coordinate geometry.
EngageNY
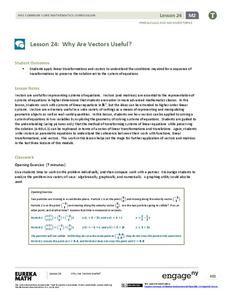
Why Are Vectors Useful? 2
Investigate the application of vector transformations applied to linear systems. Individuals use vectors to transform a linear system translating the solution to the origin. They apply their understanding of vectors, matrices,...
101 Questions
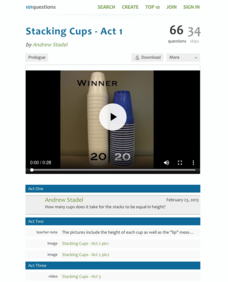
Stacking Cups
Facilitate an understanding of equality using a modeling task. After watching different-sized cups being stacked, learners use their math skills to determine when the height of each cup tower will be the same. Meant as an introduction to...
Education Development Center
Points, Slopes, and Lines
Before graphing and finding distances, learners investigate the coordinate plane and look at patterns related to plotted points. Points are plotted and the goal is to look at the horizontal and vertical distances between coordinates and...
Curated OER
Getting Started with the TI-Navigator™ System: What's My Line?
Learners analyze linear functions in this algebra lesson. They explore the meaning of slope and the slope-intercept form of a line as they investigate the effect changing parameters on the graph of a linear function.
Curated OER
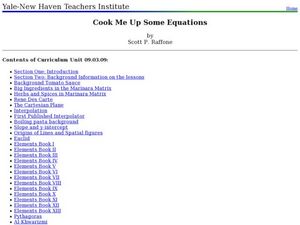
Cook Me Up Some Equations
Students study a variety of math concepts in the context of cooking up a meal. In this math lesson plan, students calculate surface area and volume. They draw and interpret different types of graphs.
Curated OER
Follow That Graph
Students investigate the graphs of six trigonometric functions. They discover how changes in the equation of the basic function affect the graph of the function.
Curated OER
Two-Variable Linear Inequalities
Here is an engaging lesson on solving equations with two variables. Have the class rewrite linear equations in the slope intercept form, y=mx + b. They graph the lines using the slope and y-intercepts.
Curated OER
Tsunami Simulation Experiment
Pupils examine an article about tsunami warning systems and discuss why they are important. They conduct an experiment that shows how the velocity of a wave in water changes with the depth.
Curated OER
Solutions, Solutions, Could it Be?
Students graph and solve linear system of equations. In this algebra lesson, students use algebraic and graphing methods to solve their systems. They find the point of intersection for their solution and draw inference from their data.
Curated OER
Spreadsheet Function Machine
Students create a spreadsheet to analyze functions. In this algebra lesson, students use spreadsheets to find the intersection of systems of equations. They identify the dependent and independent function as it relates to a line.
Curated OER
Means of Growth
Students collect and graph data. In this statistics lesson, students analyze their plotted data using a scatter plot. They identify lines as having positive, negative or no correlation.
Curated OER
How High Are the Clouds?
Pupils analyze height and collect data to create a graph. In this statistics lesson, students use central tendencies to analyze their data and make predictions. They apply concept of statistics to other areas of academics to make a...
Virginia Department of Education
How Much is that Tune?
Tune in for savings! Scholars investigate pricing schemes for two different online music download sites. After comparing the two, they determine the numbers of songs for which each site would be cheaper.


