Curated OER
Analyzing Equations Through Slope and Y-int
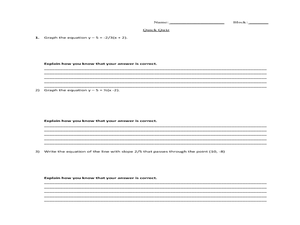
With problems applying to modern-day topics like Netflix and McDonald's, math whizzes analyze graphs and investigate the slopes. In this algebra worksheet, learners identify the slope and y-intercept of the given equations. They graph...
Curated OER
Slopes and Linear Equations
Students find the slopes of linear functions. In this graphing instructional activity, students analyze linear equations and calculate the slope of the line. They graph a line given the slope and y-intercept.
Curated OER
Analyzinf Equations Through Slope and Y intercept
Students solve equations representing exponential functions. In this algebra lesson, students interpret their equations by analyzing the slope and y intercept. They find the slope using the slope formula.
Curated OER
Lessen the Loan
Middle-schoolers explore the concept linear equations. They use the internet to navigate through videos and problems. Pupils problem solve to determine rates of change, slope, and x and y-intercepts.
Curated OER
Slopes, Slope-Intercept Form, Standard Form
Students identify the slope of an equation using various methods. In this algebra lesson, students graph linear equations and calculate the slopes using the x and y intercept to solve the equations and graph the lines. They use the slope...
Curated OER
Slopes and Slope Intercepts
Young scholars identify the slope of an equation using various methods. In this algebra lesson, students graph linear equations and calculate the slopes using the x and y intercept to solve the equations and graph the lines. They use the...
Texas Instruments
The Leaning Tower of Pisa
Learners estimate the equation of a line, angle of elevation and depression in this math lesson. They analyze e famous landmark design and make connections to algebra and geometry. They will also generate an equation, model the x and y...
Concord Consortium
Function Project
What if a coordinate plane becomes a slope-intercept plane? What does the graph of a linear function look like? Learners explore these questions by graphing the y-intercept of a linear equation as a function of its slope. The result is a...
Curated OER
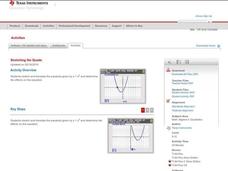
Stretching the Quads
Explore parabolas in this algebra lesson with the graphing calculator. The class investigates what effects the changing of the parameters of the vertex form of a quadrati have to its graph. They find the zeros of a quadratic graphically...
Curated OER
Slope, slope-Intercept Form and Standard Form
Students investigate and solve linear equations using slopes. In this algebra lesson, students graph lines using the slope and y intercept. They also find the slope by rewriting their equation in to slope-intercept form from standard form.
Curated OER
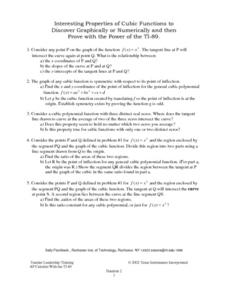
Interesting Properties of Cubic Functions to Discover Graphically or Numerically
Learners investigate the slope of a cubic function. They find the tangent line of the cubic function at point P, and discuss the relationship between point P and point Q, the point the tangent line intersects the cubic function. ...
Curated OER
Solving Systems of Equations
Learners identify the quadrants and axis of a coordinate plane. In this algebra lesson, students discover the ocrrect way to graph using the coordinate plane. They discuss the relationship between x and y values, domain and range and...
Curated OER
Race The Rapper: Slopes
Students calculate the slope of the equation In this algebra instructional activity, students graph coordinate pairs of linear equations and identify the relationship between x and y values and slope. They differentiate between...
Curated OER
The Phone Bill Problem
Students write an equation for a linear function. In this algebra lesson, students collect data, plot it and graph it. They identify the equation of the graphed data and define the slope and y-intercept of the graph.
Curated OER
Using Tables to Solve Linear Functions
Oh that intercept! Budding algebra masters solve linear equations from standard to intercept form. They identify the slope and y-intercept to help graph the lines, an then create coordinate pairs using a table of values. Great TI tips...
Curated OER
Graphing Polynomials
Students graph polynomial equations using different methods. In this algebra lesson, students identify the different ways the x and y values relate in a graph. They solve for x by finding the zero's of the polynomials.
Curated OER
Graphical Analysis
Get out your TI-nspire graphing calculator and explore polynomials. Learners determine where a given polynomial are increasing or decreasing, find maximums, minimums, and zeros of polynomials, and discuss end behavior of polynomials....
West Contra Costa Unified School District
Investigating the Discriminant
When is finding the discriminant enough? Using the quadratic formula helps find solutions to quadratic equations, but there are times when just using the discriminant is appropriate. Use this algebra II lesson to help classes see...
Curated OER
Linear Functions
Students solve, identify and define linear equations. For this algebra lesson, students calculate the slope and y-intercept of a line. They graph the line given two points and the slope.
Curated OER
Quadratic Rules and Graphs
Students identify the properties of quadratic equations. In this algebra lesson, students find the vertex and intercepts of a parabola. They factor quadratics and identify the zeros of the equations.
Curated OER
Write the Equation of a Line Given the Slope and a Point
Students write the equation of a line given the slope and y-intercept. In this algebra instructional activity, students are given a point a the line and the slope of the line and are asked to write an equation of the line. They relate...
Curated OER
Graphing Linear Equations
Students graph linear equations. In this algebra lesson plan, students perform transformation on linear equations. They identify the slope and y-intercept of each line.
Virginia Department of Education
Functions 2
Demonstrate linear and quadratic functions through contextual modeling. Young mathematicians explore both types of functions by analyzing their key features. They then relate these key features to the contextual relationship the function...
Illustrative Mathematics
Chicken and Steak, Variation 2
Many organizations put on barbecues in order to make money. In a real-world math problem, the money allotted to purchase steak and chicken at this barbecue is only one hundred dollars. It is up to your potential chefs to figure out how...


