Pennsylvania Department of Education
Equal Groups
Students explore statistics by completing a graphing activity. In this data analysis instructional activity, students define a list of mathematical vocabulary terms before unpacking a box of raisins. Students utilize the raisins to plot...
Utah Education Network (UEN)
Linear Graphs Using Proportions and Rates
Using a TI-73 or other similar graphing calculator middle school math majors investigate the linear relationship of equivalent proportions. After a brief introduction by the teacher, class members participate in a timed pair share...
Curated OER
Homemade Rocks
Student make at least FIVE rocks. They write predictions about that will change and occur. Each student receives a small cup that they label with their name to hold their rocks.
Curated OER
Introduction to Functions
Students explore functions, function rules, and data tables. They explore terms of linear functions. Students use computers to analyze the functions. Students write short sentences to explain data tables and simple algebraic expressions.
Curated OER
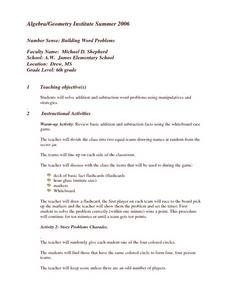
Building Word Problems
Sixth graders study addition and subtraction facts. In equal groups, they play a race game to correctly solve addition and subtraction problems. Using a PowerPoint presentation, the teacher demonstrates how to write word problems and...
Curated OER
Unit 2 Sun & Stars
Young scholars describe stellar objects using terms such as stars, planets, satellites, orbits and light. For this sun and stars unit, students research stellar objects through seven individual lessons discovering star characteristics,...
Illustrative Mathematics
Salad Dressing
Aunt Barb's salad dressing is a mixture of oil, vinegar, salt, herbs, and a pinch of math. Fifth graders add the fractional measurements of ingredients to find a total amount. The fractions have unlike denominators. After finding the...
Curated OER
Spicy Hot Colors
Second graders investigate the book Spicy Hot Colors. In this colors lesson, 2nd graders experiment mixing paint and creating different colors. Students make text to world connections and record their responses and draw pictures.
Curated OER
Data Collection - Primary Poster
Students explore the concept of collecting, analyzing, and graphing data. For this collecting, analyzing, and graphing data lesson, students create a survey about a topic of interest. Students poll their classmates, analyze, and graph...
Curated OER
Transportation Through Time
Third graders measure the speed at which they can walk in order to understand speed and distance traveled. They then research the history of transportation and express data in a class timeline.


