Curated OER
What's in a Graph?
How many yellow Skittles® come in a fun-size package? Use candy color data to construct a bar graph and a pie chart. Pupils analyze bar graphs of real-life data on the Texas and Massachusetts populations. As an assessment at the end...
Curated OER
Data and Probability: What is the Best Snack?
In this math/nutrition instructional activity, the nutritional value of 3 snack foods is recorded on a data chart and represented on a bar graph. Students analyze and compare information, construct data charts and related bar graphs, and...
National History Day
Propaganda Posters of World War I: Analyzing the Methods Behind the Images
The power of a picture. During the events surrounding World War I, propaganda posters were widely distributed in American society to sway the emotions of its citizens. By analyzing World War I propaganda posters in the first installment...
Curated OER
Graphing My Path to Success
Seventh graders examine their school performance through self-assessment of strengths and weaknesses. They construct a line graph, plotting all courses and achievements. Students use graph paper and colored pencils for each activity. If...
Curated OER
Analyzing Graphs and Data
Students collect and analyze data. In this statistics lesson, students graph their data and make inferences from the collected data. They display their data using graphs, bar graphs, circles graphs and Venn diagrams.
Curated OER
A world of oil
Learners practice in analyzing spatial data in maps and graphic presentations while studying the distribution of fossil fuel resources. They study, analyze, and map the distribution of fossil fuels on blank maps. Students discuss gas...
Curated OER
The Numbers Tell the Story
Students demonstrate how to gather and interpret statistical data. In this data analysis instructional activity, students search for statistics on the health effects of smoking and place the information into charts. Students create these...
Curated OER
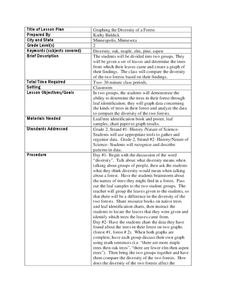
Graphing the Diversity of a Forest
Second graders work in groups to identify what types of trees create which types of leaves In this plant life lesson plan, 2nd graders analyze a set of leaves and identify the tree it came from while graphing the data in a science...
Curated OER
Temperature Bar Graph
Students explore mean, median and mode. In this math lesson, students analyze temperature data and figure the mean, median, and mode of the data. Students graph the data in a bar graph.
Curated OER
Favorite Candy Bar Graph
Students decide on six different types of candy bars to include in a data collection activity. Working in small groups, they survey a target group in a set amount of time. They access a Internet based graphing tool to create a bar graph...
Curated OER
Graphing Data Brings Understanding
Students collect, graph and analyze data. In this statistics lesson, students use circle, pie, bar and lines to represent data. They analyze the data and make predictions bases on the scatter plots created.
Curated OER
Tracking the Wild Ones
Students apply mathematic skills to discover the extent of the concern for endangered species. Students analyze graphs and look for trends in graphed results of endangered species on a global level.
Curated OER
Creating and Analyzing Graphs of Tropospheric Ozone
Students create and analyze graphs using archived atmospheric data to compare the ozone levels of selected regions around the world.
Curated OER
Earth Energy Budget Pre Lab
Students explore energy by conducting an in class experiment. In this climate change activity, students conduct a water vapor experiment in a soda bottle. Students utilize graphs and charts to analyze the results of the experiment and...
Curated OER
The Great Pollinators
Young scholars discover the reproductive parts of a plant. In this biology lesson, students identify and categorize several different plants they dissect in class. Young scholars record their information using a data chart.
Curated OER
Counting Candies
Students count, sort, and classify jellybeans by color. They use their data to create a bar graph. Students are given a small bag of jellybeans, and a worksheet on Counting Candies Tally Chart. They work in small groups. Students are...
Curated OER
Using Data Analysis to Review Linear Functions
Using either data provided or data that has been collected, young mathematicians graph linear functions to best fit their scatterplot. They also analyze their data and make predicitons based on the data. This lesson is intended as a...
Curated OER
Graphing
Students collect data and graph their results, then analyze the graphs. In this geometry lesson, students examine slopes and their graphs and discuss the relationship between the lines and the slopes.
Curated OER
Bar Graphs and Pie Charts
Students graph data they collected and analyze it using a bar graph. In this algebra lesson, students analyze their data using pie charts and bar graphs while explaining the meaning to each other. They compare and contrast bar...
Curated OER
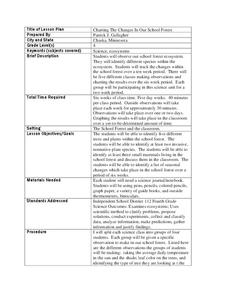
Charting the Changes in Our School Forest
Fourth graders investigate the ecosystem and how forests are disappearing. In this environmental protection lesson, 4th graders analyze the changes in their school for 2 weeks. Students practice identifying trees, birds, and...
Curated OER
Virtual Field Trip
This hands-on resource has future trip planners analyze graphs of mileage, gasoline costs, and travel time on different routes. While this was originally designed for a problem-solving exercise using a Michigan map, it could be used as a...
Curated OER
Analyzing My Path to Success
Seventh graders review their graphs from the previous lesson about trends. Individually, they identify their personal strengths and weaknesses when it comes to being successful. To end the lesson, they use this information to write a...
Curated OER
M&M Graphing and Probability
Students create a variety of graphs. They count, sort, and classify M&M's by color and record data on a chart. They use data from the chart to create pictographs, bar graphs and circle graphs. They analyze data and determine...
North Carolina State University
Exploring Genetics Across the Middle School Science and Math Curricula
Where is a geneticist's favorite place to swim? A gene pool. Young geneticists complete hands-on activities, experiments, and real-world problem solving throughout the unit. With extra focus on dominant and recessive genes, Punnett...


