Curated OER
Volcano Contour Models Activity
Students experiment with water levels and plastic topographic volcano models to determine the contour lines that would be used to create a topograpohic map of a volcano. They use the traced lines to actually develop the map.
Curated OER
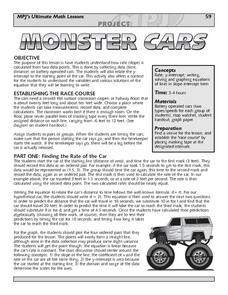
Monster Cars: Slope
Learners examine how a rate is calculated from two points. Using battery operated cars, pairs of students measure time and distance. Afterward, they use this data to calculate the rate. Learners then plot four ordered pairs and discover...
Curated OER
A Line Graph of the Ocean Floor
Students develop a spreadsheet and import the information into a line graph. In this spreadsheet and line graph instructional activity, students develop a spreadsheet of ocean depths. They import the information into a word processed...
Curated OER
Walk-A-Thon
Students graph linear http://www.lessonplanet.com/review?id=180542equations. In this problem solving lesson, students calculate slope and plot ordered pairs on a coordinate grid. Using a real-life example of a walk-a-thon, students...
Curated OER
A Contouring We Go
Students examine the built environment and infrastructures of their community by constructing contour equipment, using the equipment, and comparing their results to current topographical maps of the same area
Curated OER
Cross Section and Slope
Students draw cross sections of given contour maps. In this math lesson, students interpret the different symbols used in the map. They determine slope and steepness through direct measurement.
Ms. Amber Nakamura's Mathematics Website
Algebra Project
What would your dream house look like? A cottage? A medieval castle? High schoolers enrolled in Algebra design the perfect house while using slopes to write equations for various aspects of the project.
Curated OER
Equations Lesson Plan
Seventh graders play "What's my Rule" beginning with simple equations and working towards harder problems as student's gain confidence. They evaluate the equations by graphing them. Students identify the slope and y intercepts of the...
Curated OER
Flight of Angles of Inclination
Students measure the flight of a gilder. In this fight of angles lesson, students explore the flight of a glider and measure the distance flown. They collect statistical data of the flights and determine the slope of each flight. ...
Curated OER
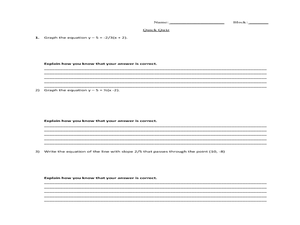
Slopes, Slope-Intercept Form, Standard Form
Students identify the slope of an equation using various methods. In this algebra lesson, students graph linear equations and calculate the slopes using the x and y intercept to solve the equations and graph the lines. They use the slope...
Curated OER
Slope, slope-Intercept Form and Standard Form
Students investigate and solve linear equations using slopes. In this algebra activity, students graph lines using the slope and y intercept. They also find the slope by rewriting their equation in to slope-intercept form from standard...
Curated OER
Equations of Lines
Students classify lines, slopes and shapes. In this calculus lesson plan, students calculate the midpoint, segment and equation of a circle. They also review what a slope and angle of inclination is.
Curated OER
Equations of Lines
Young scholars define slope, and practice finding the slope of lines through given points. They determine the angle of inclination. Students find the relationship between the slope and the tangent of the lines. Young scholars determine...
PBL Pathways
Do Homework?
To complete homework or not to complete homework ... that is the question. Decide whether it makes a difference on finals by doing homework. Individuals create a scatter plot and find a line of best fit for data on the percent of...
Curated OER
Is there Treasure in Trash?
More people, more garbage! Young environmentalists graph population growth against the amount of garbage generated per year and find a linear model that best fits the data. This is an older resource that could benefit from more recent...
PBL Pathways
College Costs
Predict the year that college costs will double in your state using linear modeling. The first part of this two-part project based learning activity asks young mathematicians to use data from the College Board. They graph the data,...
PBL Pathways
College Costs 2
What is the financial benefit for attending a community college for the first two years before transferring to a four-year college? The second part of the educational lesson asks young scholars to explore this question through data...
Radford University
Ancient Aqueduct Analysis Project
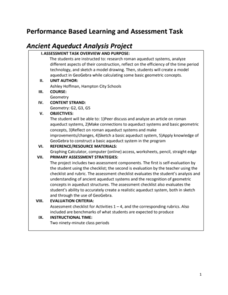
Let the class' knowledge of geometry flow like water in an aqueduct. Future mathematicians research ancient Roman aqueducts and consider the geometric concepts necessary in their construction. They then use GeoGebra to create models of...
Curated OER
Speed Is the Key
Students design and build a model downhill ski course that proves to be the fastest course at the Finish Line. They apply what they explore angles, slope, speed, and surface conditions to find the fastest course in the US.
Howard County Schools
Constant Rate Exploration
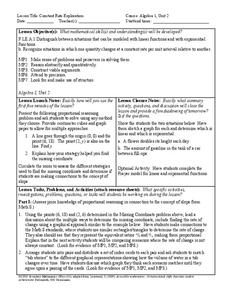
Question: What do rectangles and bathtub volume have in common? Answer: Linear equations. Learn how to identify situations that have constant rates by examining two different situations, one proportional and one not proportional.
Curated OER
Exploring Geometric Figures
Tenth graders explore mathematics by participating in hands-on daily activities. Learners identify a list of different shapes and classify them by shape, size, sides and vertices. They utilize tangrams and geometric pieces to gain...
Curated OER
"Bridge Designer" Lab
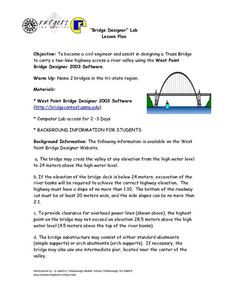
Students become civil engineers and assist in designing a Truss Bridge to carry a two-lane highway across a river valley using the West Point Bridge Designer 2003 Software. They construct bridges based upon budget and demos. Students...
Curated OER
Elevator Height as Integral of Velocity
Pupils investigate integrals and their relationship to velocity in this calculus lesson. They use the idea of a moving elevator to explore vertical motion and use the TI to help them create a visual.
Curated OER
Exploring The Depths!
Fifth graders make a model of the ocean floor. In this ocean characteristics lesson, 5th graders complete a KWL chart about the ocean floor, use the Ocean Depth Data Sheet to create a graph, and create a 3-D model of the ocean floor.
Other popular searches
- Perpendicular Lines Slope
- Finding the Slope of a Line
- Point Slope Form Linear
- Slope of Linear Equations
- Graph Line Slope Intercept
- Finding Slope Secant Line
- Find the Slope of a Line
- Finding Slope of a Line
- Determining Slope of a Line
- Parallel Lines and Slope
- Find Slope of a Line
- Slope Line Intercept

