Curated OER
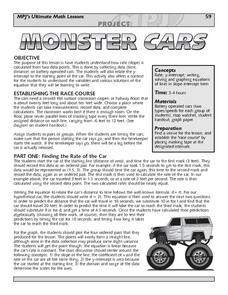
Monster Cars: Slope
Learners examine how a rate is calculated from two points. Using battery operated cars, pairs of students measure time and distance. Afterward, they use this data to calculate the rate. Learners then plot four ordered pairs and discover...
Curated OER
A Line Graph of the Ocean Floor
Students develop a spreadsheet and import the information into a line graph. In this spreadsheet and line graph instructional activity, students develop a spreadsheet of ocean depths. They import the information into a word processed...
Curated OER
Is there Treasure in Trash?
More people, more garbage! Young environmentalists graph population growth against the amount of garbage generated per year and find a linear model that best fits the data. This is an older resource that could benefit from more recent...
Curated OER
Equations Lesson Plan
Seventh graders play "What's my Rule" beginning with simple equations and working towards harder problems as student's gain confidence. They evaluate the equations by graphing them. Students identify the slope and y intercepts of the...
Curated OER
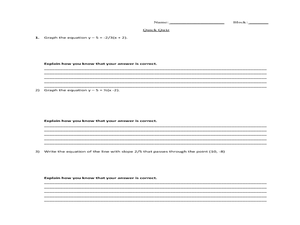
Slopes, Slope-Intercept Form, Standard Form
Students identify the slope of an equation using various methods. In this algebra lesson, students graph linear equations and calculate the slopes using the x and y intercept to solve the equations and graph the lines. They use the slope...
Curated OER
Slope, slope-Intercept Form and Standard Form
Students investigate and solve linear equations using slopes. In this algebra activity, students graph lines using the slope and y intercept. They also find the slope by rewriting their equation in to slope-intercept form from standard...
Curated OER
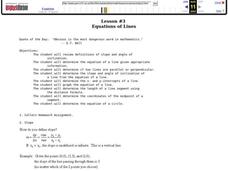
Equations of Lines
Young scholars define slope, and practice finding the slope of lines through given points. They determine the angle of inclination. Students find the relationship between the slope and the tangent of the lines. Young scholars determine...
PBL Pathways
Do Homework?
To complete homework or not to complete homework ... that is the question. Decide whether it makes a difference on finals by doing homework. Individuals create a scatter plot and find a line of best fit for data on the percent of...
PBL Pathways
College Costs 2
What is the financial benefit for attending a community college for the first two years before transferring to a four-year college? The second part of the educational lesson asks young scholars to explore this question through data...
PBL Pathways
College Costs
Predict the year that college costs will double in your state using linear modeling. The first part of this two-part project based learning activity asks young mathematicians to use data from the College Board. They graph the data,...
Howard County Schools
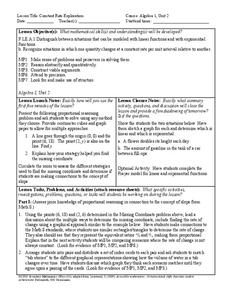
Constant Rate Exploration
Question: What do rectangles and bathtub volume have in common? Answer: Linear equations. Learn how to identify situations that have constant rates by examining two different situations, one proportional and one not proportional.
Curated OER
Speed Is the Key
Students design and build a model downhill ski course that proves to be the fastest course at the Finish Line. They apply what they explore angles, slope, speed, and surface conditions to find the fastest course in the US.
Curated OER
Exploring Geometric Figures
Tenth graders explore mathematics by participating in hands-on daily activities. Learners identify a list of different shapes and classify them by shape, size, sides and vertices. They utilize tangrams and geometric pieces to gain...
Curated OER
3-D Topographic Maps
Students create a 3-D topographic map. In this map building lesson, students use cardboard to create a topographic map of the Catskills mountain region.
Curated OER
Slip Slide'n Away
Young scholars analyze the sliding of boxes along a warehouse floor. In this algebra lesson, students connect math and physics by calculating the friction created by the sliding of each box. They develop faster method to move the box,...
Curated OER
Go the Distance
Students work together to build lego cars. They make predictions about how fast they believe the cars will go. They record their observations and discuss their results.
