PBL Pathways
Doctors and Nurses
How many nurses does it take to support one doctor? A project-based activity asks learners to analyze state data to answer this question. Classes create polynomial functions from the data of doctors and nurses over a seven-year...
Radford University
Let's Buy a Car
Ready to buy a car? Learners research different makes and models of cars to decide on the best one to buy. They collect data on cost, fuel efficiency, safety ratings, and insurance costs, then create and analyze data displays to make...
Curated OER
The Power of Graphical Display: How to Use Graphs to Justify a Position, Prove a Point, or Mislead the Viewer
Analyze different types of graphs with learners. They conduct a survey and determine the mean, median and mode. They then identify different techniques for collecting data.
Curated OER
Using Graphical Displays to Depict Health Trends in America's Youth
Identify the different types of graphs and when they are used. Learners will research a specific health issue facing teens today. They then develop a survey, collect and analyze data and present their findings in class. This is a...
Curated OER
Data Analysis Digital Display
Young scholars create a survey online. For this math lesson, students graph survey data using flisti.com. They share and analyze their classmates' histogram.
Curated OER
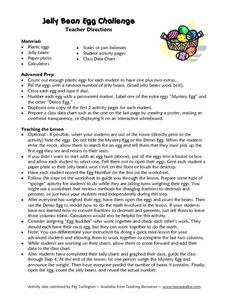
Jelly Bean Egg Challenge
Students each receive a plastic egg filled with jelly beans. In this Jelly Bean Egg Challenge, students estimate and weight their eggs, they count the number of jelly beans inside their egg, they chart their data and compare their data...
Curated OER
Fun with Math using Magnetic Force
Sixth graders explore and discuss the effectiveness of magnets in different situations. In this math instructional activity, 6th graders discuss rate and graphs after exploring with magnets using different restrictions on the magnets....
Curated OER
Leaping Lemurs! How far can you jump?
Learners watch a segment of the PBS video which show the lemurs' ability to jump. In pairs, students collect measurement data involving each other's length of a standard step, a standing broad jump, and a long jump. They record their...
Curated OER
Super Spreadsheets
Middle schoolers discover information about each of the fifty states in the United States. In groups, they create a spreadsheet organizing the information to show to the class. They discover different ways to display the data and...
Curated OER
Put Your Heart Into It
First graders sort Valentine candies according to kind. Data is inserted into a spreadsheet and displayed in various graphic formats.
Curated OER
Percents: What's the Use
Students research percentages in real world situations. For this percents lesson, students demonstrate their ability to apply percents to everyday situations. Students communicate mathematically by conducting interviews about percents...
Curated OER
Food Pyramid - Daily Diet Diary
Students keep a daily diet diary and discuss the Food Pyramid. They investigate other geometric shapes as a way to display daily food guidelines. In groups, they design a menu for the Food Pyramid Restaurant.
Curated OER
Be An Expert
Part of a series of lessons about bring Native American stories into the classroom, this plan suggests having kids research and take notes on one group of Native Americans and then complete a project that they present to the class. Pull...
Curated OER
Reconstructing the Squares
Young scholars visit an outdoors area and mark out a square on the ground that they examine, looking for living and non-living things. They make a model or drawing of the findings from the actual square.
Curated OER
Scientific Method in Action
High schoolers investigate the current environmental movement by cleaning up their own campus. In this environmental care lesson plan, students practice cleaning their "environment" by picking up trash on their campus and decrease...
Curated OER
Percents: What's the Use?
Students explore percentages in real world situations. In this percents lesson plan, students determine the final sales price after discounts. Students interview community members and determine how percentages are used in the real world.
Curated OER
You're a Grand Ol' Flag
Students explore American flag and its symbols, and create an original flag that represents what they see in their own lives.
Curated OER
Something From Nothing
Learners listen to story Joseph Had A Little Overcoat to explore people from another culture and how one item can be used to make other items; students use scraps of fabric and other knickknacks to create pictures or toys.
Curated OER
Lesson 9: Visual Meiosis
Students create a fictional organism. In this biology lesson, students predict the traits of resulting offspring. They complete activity worksheet and discuss answers in class.
Curated OER
Recording Treasure
Students participate in a garage sale. They will weigh the items sold. They will calculate the total weight of items sold and donated to an agency.
Curated OER
Spreadsheet Graphs
Students create graphs using information from spreadsheets. They select a topic from the following choices: website use, digital cameras, spreadsheets, calculators or educational software. They tally the class results and create an...
Curated OER
Geo-Town
Second graders use a checklist to construct a Geo-Town map including a compass rose, a map key, and a paragraph about a walk around Geo-Town, using appropriate geometric and directional vocabulary to identify the two-dimensional figures...


