Kenan Fellows
Saving Those Who Save Us: Exploring the Use of Sensors with Data Visualization
Sensor technology is amazingly accurate and useful. Combining the sensor technology and mathematical knowledge, scholars design experiments to answer a question they have developed. Questions may focus on light sensing, temperature...
Curated OER
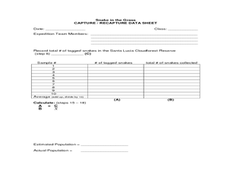
Snake in the Grass: Capture/Recapture Activity
Learners estimate the total number of species in Ecuador using the capture/recapture method. They collect data about each species and act as members of a science expedition to determine the total number of species by using mathematical...
Curated OER
Measurement of Biotic and Abiotic Objects
Young scholars identify biotic and abiotic factors. For this environmental study lesson, students conduct a series of experiments to collect and record data and draw conclusions based on the results.
Curated OER
The Power of Graphical Display: How to Use Graphs to Justify a Position, Prove a Point, or Mislead the Viewer
Analyze different types of graphs with learners. They conduct a survey and determine the mean, median and mode. They then identify different techniques for collecting data.
Curated OER
Bird Feeding and Migration Observation
Students research bird migration and build a bird house. For this bird lesson plan, students research the birds in their area and where they migrate to. They also build their own bird house and record data on what kinds of birds come to...
Curated OER
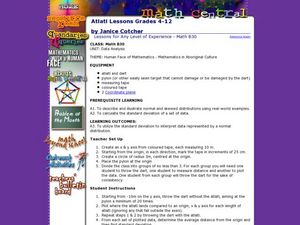
Human Face of Mathematics - Mathematics in Aboriginal Culture
Young scholars collect statistical data. In groups, students play a dart game and then determine the distance between darts. They collect the data and plot the information on a coordinate plane. They identify the mean and the standard...
Curated OER
Calculating Profits from Selling Virtual Lemonade
Students set up and collect data for a virtual lemonade stand. In this entrepreneurship, economics, and technology instructional activity, students purchase ingredients, determine costs, and set up a virtual lemonade stand. Students...
Curated OER
Student Heights
Students measure the heights of their fellow classmates and create a box and whisker plot to display the data. In this measurement lesson plan, students analyze the data and record results.
Curated OER
Tables, Charts and Graphs
Students examine a science journal to develop an understanding of graphs in science. In this data analysis lesson, students read an article from the Natural Inquirer and discuss the meaning of the included graph. Students create a...
Curated OER
Scatter Plots
Seventh graders investigate how to make and set up a scatter plot. In this statistics lesson, 7th graders collect data and plot it. They analyze their data and discuss their results.
Curated OER
Identification of Different Compounds and Substances
Students conduct a series of tests to identify unknown compounds. In this chemistry lesson, students compare the physical and chemical properties of substances. They collect data and formulate a conclusion.
Curated OER
I'm a Weather Watcher Watching plants grow by......my,my,my
Students investigate how weather affects how plants grow. They collect data on weather and plant growth for a week and display the data on a graph. For a culminating experience they design a movie using software that shows plant growth...
Curated OER
Statistics Newscast in Math Class
Students study sports teams, gather data about the teams, and create a newscast about their data. In this sports analysis lesson, students research two teams and define their statistical data. Students compare the two teams, make...
Curated OER
Weather Watchers
Students watch the weather. In this science observation lesson, students collect data regarding the local weather and create their own weather forecasting video.
National Gallery of Canada
Counting Circles
Learners look at bands of colors and estimate how many rings of color there are. While working in groups, they come up with a plan of how to accurately count the rings. They attempt to find a pattern in the colors, and decide whether...
Curated OER
How Do We Solve the Problem of Wildlife on Our Roads?
Students analyze data on elk ecology and movements across the highway. In this ecology lesson, students research ways to save them from highway collisions. They write a report and present their findings in class.
Curated OER
If I Can't See It, How Do I Know It's There?
Students build a model ocean using a variety of materials representing the various levels of the ocean. They collect data about the ocean floor in a partner activity. They practice working with topographical mapping grids.
Curated OER
How Creepy!
Pupils infer the importance of keeping accurate records. In this physics lesson, students observe, measure and collect data from a creeping material. They graph their data and share it to class.
Curated OER
Dating Practices
High schoolers interpolate, extrapolate, and make predictions from given information. They present results and conclusions from given data using basic statistics. Pupils create a survey from a critical question and decide which sampling...
Curated OER
Air in Soil Administration Procedures
Students study soil and its composition. In this soil composition lesson, students study examples of soil during several days of aeration. Students summarize their data, organize it, and must be able to explain their findings.
Curated OER
Wild Dog Urine
Learners investigate biology by researching wild animals. For this animal extinction lesson, students research African wild dogs and discuss the impact of the environment on their survival. Learners read and analyze an article titled...
Curated OER
Weather "Why"
Students research weather and explore how to use their research information. In this weather information instructional activity, students visit a given website for weather forecasts. Students graph the weather, sing weather songs and...
Curated OER
Emulsions
Students identify the characteristics and composition of emulsions. In this chemistry lesson, students classify household products according to emulsion type. They explain how to make the best emulsion.
Curated OER
Graphing Canada
Students research a province of Canada choosing a question to investigate. They record their information on a worksheet that is provided and complete a graph. They present their bar graphs to the class.


