Teach Engineering
Exploring Variables While Testing and Improving Mint-Mobiles (for High School)
Mint candies are good for more than just one's breath. Using basic materials such as mint candies, straws, index cards, and Popsicle sticks, scholars create race cars that meet a given budget as well as design constraints. They perform...
Curated OER
Ornithology and Real World Science
Double click that mouse because you just found an amazing lesson! This cross-curricular Ornithology lesson incorporates literature, writing, reading informational text, data collection, scientific inquiry, Internet research, art, and...
Curated OER
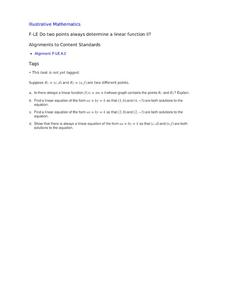
Do Two Points Always Determine a Linear Function II?
Learners analyze the difference between the slope intercept and standard forms of a line in this task. Given two general points using letters they explore linear functions and linear equations.
PBS
Accessible Shapes
All the 2-D and 3-D measurement work you need is in one location. Divided into three sections, the geometry lesson plans consist of visualization of three dimensions, classifying geometric figures, and finding surface area and volume....
Curated OER
Describing Data
Your learners will practice many ways of describing data using coordinate algebra in this unit written to address many Common Core State Standards. Simple examples of different ways to organize data are shared and then practice problems...
American Statistical Association
EllipSeeIt: Visualizing Strength and Direction of Correlation
Seeing is believing. Given several bivariate data sets, learners make scatter plots using the online SeeIt program to visualize the correlation. To get a more complete picture of the topic, they research their own data set and perform an...
Population Connection
Where Do We Grow from Here?
Did you know that the population is expected to grow to 11 billion by 2100? The resource serves final installment in a six-part series on the global population and its effects. Scholars interpret data from the United Nations about the...
Curated OER
After Reading: "Plot the Plot" Activity in the Library Media Class
"Plot the plot" of "The Adventures of the Speckled Band" with your young readers. Take a few days to read Sir Arthur Conan Doyle's short story as a class or in pairs, having learners write down what they consider to be the most important...
Howard Hughes Medical Institute
Tracking Genetically Modified Mosquitoes
What's that buzzing in your ear? An insightful lesson about genetically modified mosquitoes! Partnered pupils explore the creation, release, and monitoring of mosquitoes designed to reduce the mosquito population. After watching a video,...
EngageNY
Comparison Shopping—Unit Price and Related Measurement Conversions
Speed up your scholars' understanding of ratios. Class members compare ratios related with speeds presented in different representations. They then use the unit rates to make the comparisons.
Wake Forest University
Authentic Activities for Connecting Mathematics to the Real World
Check out the handout from a presentation that contains a collection of high school algebra projects connecting a variety of mathematics to the real world. Activities range from simple probabilities to calculus. The activities can be...
Statistics Education Web
Consuming Cola
Caffeine affects your heart rate — or does it? Learners study experimental design while conducting their own experiment. They collect heart rate data after drinking a caffeinated beverage, create a box plot, and draw conclusions. They...
Statistics Education Web
Saga of Survival (Using Data about Donner Party to Illustrate Descriptive Statistics)
What did gender have to do with the survival rates of the Donner Party? Using comparative box plots, classes compare the ages of the survivors and nonsurvivors. Using the same method, individuals make conclusions about the gender and...
Statistics Education Web
Who Sends the Most Text Messages?
The way you use statistics can tell different stories about the same set of data. Here, learners use sets of data to determine which person sends the most text messages. They use random sampling to collect their data and calculate a...
Federal Reserve Bank
Lesson 4: Back to School
Based on your current level of human capital, how long would it take you to earn $1,000,000? What about your potential human capital? Learners explore the importance of education and experience when entering the workforce, and compare...


