Illustrative Mathematics
Weather Graph Data
Teaching young mathematicians about collecting and analyzing data allows for a variety of fun and engaging activities. Here, children observe the weather every day for a month, recording their observations in the form of a bar graph....
Curated OER
The Mitten
Explore the Ukraine through a reading of The Mitten. Readers will determine the sequence of events, cause and effect, make predictions, and find the main idea of the story. They also use math skills to make charts and graphs. Finally,...
Curated OER
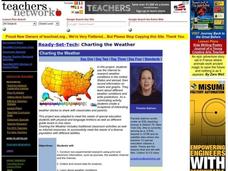
Charting the Weather
Students research and conduct non-experimental research, such as journals, the weather channel and the internet, to collect and record data for analysis on weather conditions in the United States and abroad. They identify, pronounce and...
Curated OER
Weather Report Chart
Students complete a weather report chart after studying weather patterns for a period of time. In this weather report lesson, students measure temperature, precipitation, cloud cover, wind speed, and wind direction for a month. Students...
Curated OER
Jumping to Conclusions
Students decide as a class what their data is going to be to graph. In this math lesson, students organize data so that it will be easier to display in a graph. Students are guided through the process by their teachers, and helped with...
Curated OER
Weather Observation Journal
Students record weather for a period of one month. In this weather lesson, students observe weather for one month on a large pictograph. Students record clouds, wind, temperature and any other weather conditions they observe. Students...
Curated OER
Chucky Chickadee's Bird and Breakfast: Sing in Please
Students observe bird feeding and complete a tally and graphing activity for their observations. In this bird graphing instructional activity, students work in teams to observe bird feedings. Students complete a bird reporting sheet and...
Curated OER
The Air Up There
In this data collection and analysis lesson, students observe and graph the weather conditions during one school week, then calculate the average weather temperature. Extensions are included.
Curated OER
The Hat
Honing reading and communication skills through the theme of farm animals is the focus of this lesson. Students read a book about Scandinavian farm animals and complete prediction journal activities. They complete a worksheet about the...
Curated OER
How to Beat the Rainy Day Blues
With a little ingenuity, lively exercise can occur despite the weather.
Curated OER
Introducing Temperature Measurement
Students explore temperature and use Celcius thermometers to measure and graph the temperature in the classroom daily. They estimate what they think the temperature might be and then find the actual temperature in the room.


