Curated OER
Remote Possibilities
Students collect data and analyze the data using a graph. In this statistics lesson, students use combinations and theoretical and experimental probability to analyze their data. They observe a remote controlled robot as they collect data.
Curated OER
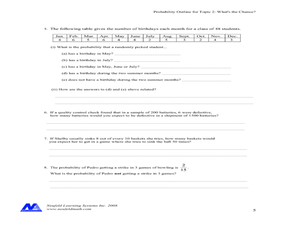
Concept: What's The Chance?
In this concept worksheet, students perform probability experiments. Using collected information, they interpret the data. Students answer questions about probability. This five-page worksheet contains approximately 15 multi-step...
Curated OER
What are My Chances?
Students calculate the chance of an event occurring. In this statistics lesson, students use combination and permutation to calculate the probability of an event occurring. They differentiate between theoretical and experimental...
Curated OER
What's in the Bag?
Students calculate the probability of an event occurring. In this statistics lesson, students calculate the outcome using combination and permutation. They differentiate between-theoretical and experimental probability.
Curated OER
The Monty Hall Problem
Young scholars define and differentiate between experimental and theoretical probability. For this statistic lesson, students play the game "Monty Hall" and use probability to come up with the best strategies to play the game.
Texas Instruments
Probability of Repeated Independent Events
Statisticians analyze different samples to find independent and dependent events. In this probability lesson, pupils predict the outcome and then calculate the real outcome. They create a tree diagram to help predict the probability of...
Statistics Education Web
Consuming Cola
Caffeine affects your heart rate — or does it? Learners study experimental design while conducting their own experiment. They collect heart rate data after drinking a caffeinated beverage, create a box plot, and draw conclusions. They...
Curated OER
Probability and Expected Value
Students collect data and analyze it. In this statistics lesson, students make predictions using different outcomes of trials.
Curated OER
Chaos
Young scholars experiment with several chaotic simulation, they build a working definition of chaos. Students reinforce their knowledge of basic probability and percents. They are reminded of previous knowledge that is pertinent to...
Curated OER
ng Data: Probability, What's in the bag?
Students use the language associated with probability to discuss events including those with equally likely outcome. They collect data from a simple experiment and record in a frequency table: estimate probabilities based on this data
Curated OER
Let's Take a Chance!
Students investigate probability and the chance of an even happening. In this algebra activity, students incorporate their knowledge of probability to solve problems and relate it to the real world. They learn to make decisions based on...
Shodor Education Foundation
Tree Diagrams and Probability
Aspiring statisticians create tree diagrams and figure probabilities of events based on those diagrams. They practice adding and multiplying fractions and explain complementary probabilities. Students use computers activities to make...
Curated OER
Probability and Statistics
Students are taught to search the internet for statistics concepts on sports. In this probability lesson, students collect data and use the calculator to graph and analyze their data. They graph and make predictions about sports using...
Curated OER
Data and Probability- What's the Chance?
Young scholars investigate probability through a game. In this data lesson plan, students use dice and predictions to explore how probability works.
Bowland
Crash Test
Use mathematics and simulations to investigate car crashes. IScholars test hypotheses involving car crashes. They collect, analyze, and display data from computer simulations to support or refute their hypotheses.
Curated OER
Seeing Is Believing
Students investigate the concepts of probability. They use data to find the central tendency, median, and mode. Students design and play a game in order to practice the concepts. They also complete a table with data that is analyzed.
Pennsylvania Department of Education
Equally Likely and Unequally Likely Outcomes
Students explore probability. In this statistics/probability instructional activity, students compare experimental and theoretical probability and use experimental probability to make predictions and conjectures. Students explore the...
Curated OER
Data and Scientific Graphs
Learners conduct experiments and graph their data. In this statistics instructional activity, students collect data and graph it on a coordinate plane. They analyze the data looking for patterns and they discuss their findings with the...
Curated OER
Probability Review
Students engage in a lesson that is concerned with the concepts related to probability. They review the key properties of statistics involved in the measurement of probability that includes mean, median, and mode. The lesson includes...
Curated OER
Variations on a Human Face Lab
Ninth graders gain an application level understanding of probability, symmetry, and ratios and rates that exists in one's everyday environment relative to human genetics.
Curated OER
M&M Exponential Activity
Students create a scatter plot of their experimental data. In this algebra lesson, students use M&M's to determine an algebraic model. They discuss results in class.
Curated OER
Disease and Epidemics
Explore how the study of diseases and epidemics can be comprehended from a mathematical perspective. Investigate finite geometric series, calculating threshold values, and statistical models of the spread of disease. How many makes it an...
Curated OER
The Bell Curve
Learners are introduced to the concepts of the normal curve, skewness and the standard deviation. They discuss how the normal distribution has been used and misused to support conclusions.
Curated OER
Entrance Ticket
Young scholars collect data on different events and word problems. In this algebra instructional activity, students use a table to organize their data. They graph their coordinate pairs on a coordinate plane and make predictions.


