Curated OER
Let's Go Slopey
Young scholars create a table of values to graph a line. In this algebra lesson, students identify the slope and intercept of a linear equation. They use a Ticalculator to graph their function.
Curated OER
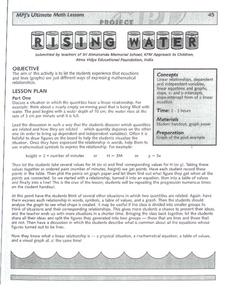
Rising Water
Eighth graders discuss a situation with quantities that relate in a linear fashion. They discuss ways to determine the relationship. Students represent this relationship with mathematic symbols. Students discuss the meaning of...
Curated OER
Perpendicular to an Equation through a Point
In this algebra worksheet, students write a line perpendicular to given slope-intercept equation and a given point. There are 6 questions.
Curated OER
Applying Properties to Variables
Eighth graders combine like terms in this properties of variables lesson plan. Using named items (stars, moons and hearts), they combine like terms using variables. They use the distributive property to combine like terms. Finally, they...
BW Walch
Solving Systems of Linear Equations
Solving systems of equations underpins much of advanced algebra, especially linear algebra. Developing an intuition for the kinds and descriptions of solutions is key for success in those later courses. This intuition is exactly what...
Curated OER
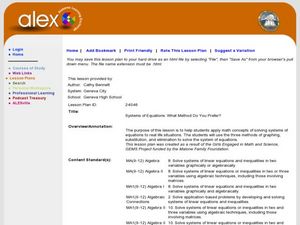
Systems of Equations: What Method Do You Prefer?
Students explore the concept of solving systems of equations. In this solving systems of equations lesson, students watch YouTube videos about how to solve systems by graphing and by elimination. Students use an interactive website to...
5280 Math
More or Less the Same
Tell the story of the math. Given a graph of a linear system, learners write a story that models the graph before crafting the corresponding functions. Graphs intersect at an estimated point, allowing for different variations in the...
Curated OER
Inquiry Unit: Modeling Maximums and Minimums
Young mathematicians explore the maximun area for patio with the added complexity of finding the mimimum cost for construction. First, they maximize the area of a yard given a limited amount of fence and plot width v. area on a scatter...
Curated OER
The Way to Better Grades!
Pupils collect and analyze data. In this statistics lesson, learners create a scatter plot from their collected data. They use, tables and graphs to analyze the data and mae decisions.
Curated OER
Graphing Linear Equations
For this calculator active graphing worksheet, students graph 12 equations via a calculator and transfer the graphs onto coordinate grids.
West Contra Costa Unified School District
Graphing Systems
Get hands on with solving systems of equations graphically. A solid lesson plan uses guided practice to show how to solve systems of linear equations. It allows time for sharing ideas and provides a printable matching activity to promote...
Alaska Department of Education
Mathematics Reference Sheet
Triangles and prisms don't stand a chance when your learners use this handout full of the formulas they need to know about the different shapes. Area, volume, and surface formulas are all covered along with the standard measurement and...
Curated OER
How Long Can You Go?
Eighth graders examine the usefulness of a line of best fit by collecting and graphing data, using a graphing calculator to determine the line of best fit, and making a variety of predictions. They watch a video, then design a...
101 Questions
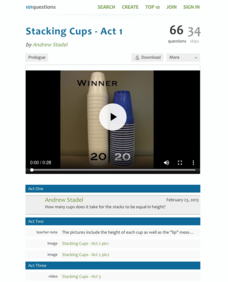
Stacking Cups
Facilitate an understanding of equality using a modeling task. After watching different-sized cups being stacked, learners use their math skills to determine when the height of each cup tower will be the same. Meant as an introduction to...
Curated OER
Graphing Inequalities in Two Variables
This study guide is a great resource to help you present the steps to graphing linear inequalities. Show your class two different ways to graph an inequality and work on a real-world example together. The document could also be easily...
Wordpress
Introduction to Exponential Functions
This lesson begins with a review of linear functions and segues nicely over its fifteen examples and problems into a deep study of exponential functions. Linear and exponential growth are compared in an investment task. Data tables are...
Curated OER
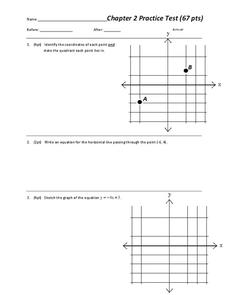
Chapter 2 Practice Test
In this algebra worksheet, students examine and graph linear equation, inequalities, and absolute value inequalities in two variables. The three page worksheet contains forty-six problems. Answers are not included.
Curated OER
Chapter 2 Practice test
Overall, this worksheet contains a good selection of problems that reviews different aspects of linear equations. Learners examine and graph linear equations, absolute value equations, and inequalities in two variables. The three page...
Virginia Department of Education
Transformation Investigation
Graph it! Investigate transformations with a graphing calculator. Pupils graph sets of linear functions on the same set of axes. They determine how changes in the equation of a linear function result in changes in the graph.
Curated OER
Algebra 1
Students study the functional relationships of a variety of problems. For this functional relationship lesson, students determine the dependent and independent quantities of a given set of data. Students record the data and write it in...
Curated OER
Drug Sales Soar - Rate of Change
In this prescription drug worksheet, students answer short answer questions and create graphs on the sales of prescription drugs over a five year span. Students complete six questions.
Curated OER
Iterating Linear Functions
Learners use a spreadsheet to investigate data. In this algebra lesson, students collect and graph data on a coordinate plane. They explain properties of a linear equation both algebraically and orally.
Curated OER
Investigating Linear Equations Using Graphing Calculator
Students investigate linear equations using the Ti-Calculator. In this algebra lesson plan, students graph lines and identify the different quadrants on a coordinate plane. They identify ordered pairs used to plot lines.
Curated OER
Price of Apples- Linear Data
Students collect data and create a graph. In this algebra instructional activity, students describe functions graphically, algebraically and verbally. They identify functions as being independent and dependent using variables.
Other popular searches
- X Y Slope Intercept
- Y Intercept and Slope
- Slope Y Intercept Equation
- Slope Y Intercept Activities
- Slope Y Intercept Equation
- Graph Slope and Y Intercept
- Slope and Y Intercept Formula
- Slope Y Intercept Form
- Slope Y Intercept Graphing
- Slope Y Intercept Quiz
- Finding Slope and Y Intercept
- Slope, Y Intercept Quiz


