EngageNY
The Graph of a Linear Equation in Two Variables
Add more points on the graph ... and it still remains a line! The 13th installment in a series of 33 leads the class to the understanding that the graph of linear equation is a line. Pupils find several solutions to a two-variable linear...
EngageNY
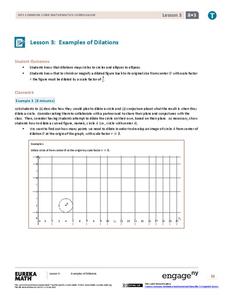
Examples of Dilations
Does it matter how many points to dilate? The resource presents problems of dilating curved figures. Class members find out that not only do they need to dilate several points but the points need to be distributed about the entire curve...
EngageNY
Dilations on the Coordinate Plane
Dilations from the origin have a multiplicative effect on the coordinates of a point. Pupils use the method of finding the image of a point on a ray after a dilation to find a short cut. Classmates determine the short cut of being able...
Curated OER
Walk-A-Thon
Young scholars graph linear http://www.lessonplanet.com/review?id=180542equations. In this problem solving lesson, students calculate slope and plot ordered pairs on a coordinate grid. Using a real-life example of a walk-a-thon, young...
EngageNY
The Graph of a Linear Equation in Two Variables Is a Line
Show your class that linear equations produce graphs of lines. The 20th segment in a unit of 33 provides proof that the graph of a two-variable linear equation is a line. Scholars graph linear equations using two points, either from...
Illustrative Mathematics
Find the Change
This exercise is an opportunity for algebra learners to understand the connection between the slope of a line and points found on the line. Use similar triangles to explain why slope m is the same between any two points. Discuss with the...
Computer Science Unplugged
Ice Roads–Steiner Trees
As an introduction to Steiner Trees, class members are challenged to find the shortest paths to connect multiple points. The teacher introduces the problem by showing how to connect three points. Groups then go outside and construct a...
Math Drills
Thanksgiving Cartesian Art: Pilgrim Hat
What did some Pilgrims wear on top of their heads? Individuals graph sets of ordered pairs, and connect the points to create a mystery Thanksgiving picture.
Education Development Center
Geography of the Coordinate Plane
Put the graph into graphing and allow learners to understand the concept of point plotting and how it relates to data. The worksheet provides a nice way to connect data analysis to a graph and make predictions. The worksheets within the...
EngageNY
Constant Rate
Two-variable equations can express a constant rate situation. The lesson presents several constant rate problems. Pupils use the stated constant rate to create a linear equation, find values in a table, and graph the points. The resource...
CK-12 Foundation
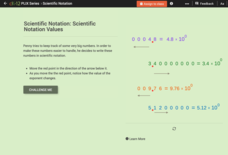
Scientific Notation Values
Scientific notation is the focus of a five-question interactive. A model with movable points offers a visual reference to help solve true or false, multiple-choice, and fill in the blank questions. A discussion question challenges...
Curated OER
Archimedes
In this Archimedes instructional activity, students complete and respond to 4 different problems related to different triangles. First, they find the midpoint of each side of a given triangle. Then, students connect the midpoints with...
Curated OER
Measuring Segments
Middle and high schoolers solve 14 problems that include finding the distance between two points in different situations. First, they refer to a number line to find the measure of each point on the line. Then, pupils refer to the...
Curated OER
The Stock Market
Students explore the loss and gain made in the stock market as they invest a sum of money and report the results as percentages instead of points.
Curated OER
Discovering PI
In this pi worksheet, students identify and complete 4 different problems that include pi and graphing data points. First, they complete the chart at the top by measuring the diameter and circumference of each object. Then, students plot...
Curated OER
Point-Slope Worksheet
For this point-slope worksheet, students write the equation of a line. Each of the 8 problems presents students with an ordered pair and the slope.
Curated OER
Applying the Pythagorean Theorem
Learners use the Pythagorean Theorem to find the distances between two points. Use this Pythagorean Theorem lesson plan to have learners find the distances on a coordinate plane in small groups.
EngageNY
The Line Joining Two Distinct Points of the Graph y=mx+b Has Slope m
Investigate the relationship between the slope-intercept form and the slope of the graph. The lesson plan leads an investigation of the slope-intercept equation of a line and its slope. Pupils realize the slope is the same as the...
Curated OER
The Power of Graphical Display: How to Use Graphs to Justify a Position, Prove a Point, or Mislead the Viewer
Analyze different types of graphs with learners. They conduct a survey and determine the mean, median and mode. They then identify different techniques for collecting data.
College Preparatory Mathematics
Using Elimination To Find the Point of Intersection of Two Lines
Two example problems are solved on the first page using the elimination method with a pair of linear equations. Detailed explanations accompany the math. The second page provides 20 practice problems and their answers. This would be a...
Alabama Learning Exchange
We Love to Graph!
Students experience graphing points. In this graphing points lesson, students play an on-line game where they must name 10 coordinate pairs correctly. Students play a maze game where they maneuver a robot using coordinate pairs. ...
Curated OER
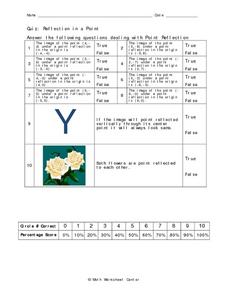
Quiz: Reflection in a Point
In this reflection activity, students read short statements about reflecting a point or an image over the x-axis in a coordinate plane. They identify the location of the given coordinates and determine if the statement is true or false....
Curated OER
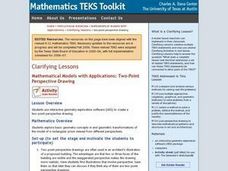
Mathematical Models with Applications: Two-Point Perspective Drawing
Students use interactive geometry exploration software (GES) to create a two-point perspective drawing. They explore basic geometry concepts in and geometric transformations of the model of a rectangular prism viewed from different...
Curated OER
Plotting Points
Eighth graders practice plotting points on a coordinate plane. As a class, they create and label the parts of a graph. Given ordered pairs, they plot the points, connect them to reveal a particular shape, and find the area of the shape.
Other popular searches
- Plotting Points on Graph
- Boiling Point
- Geometry Lines Points Rays
- Plotting Coordinates
- Plotting Coordinates Picture
- Plotting Points
- Power Points Aztecs
- Exclamation Marks
- Data Points
- Marine Biology Power Points
- Distance Between Two Points
- Cardinal Points


