Curated OER
Bubbles
Eighth graders experiment with a number of dishwashing liquids to determine the duration of the bubbles. They graph the data, add glycerin to the dishsoap, and repeat the experiment. They graph and compare the data sets.
Curated OER
Drops on a Penny
Eighth graders experiment to determine the number of drops of water a heads up penny hold. They create a stem and leaf graph of the class results and use the data for further experimentation on a tails up penny.
Curated OER
Walking the Plank
Eighth graders experiment with a bathroom scale, books and a plank to determine how weight readings change as distance is applied. They graph and interpret the results.
Curated OER
Wacky Water World
Eighth graders calculate a system of equations to find the best ticket price for a ticket at a water park. They explain how the equations helped them make their decision on the best price.
Curated OER
Probability: the Study of Chance
Students experiment to determine if a game is fair, collect data, interpret data, display data, and state and apply the rule for probability. Students use a simple game for this experiment.
Curated OER
"YIKES! Your Body Up Close" by Mike Janulewicz
Students use a Venn Diagram to analyze data from their class.
Curated OER
Firewood Problem
Middle schoolers write and solve their own story problems. They determine the cost of firewood by the cord. They organize their data in graphs and charts.
Curated OER
Parting Ways
Students become part of the solution as they practice figuring percents. The number of men versus women present in the room and their heights can be used to form the basis of this investigation.
Curated OER
Getting to the Bottom of the Pyramids
Middle schoolers work together to develop logical arguments about pyramids and chain letters. They share their ideas with other groups and create a diagram showing the breakdown. They discuss the results.
Curated OER
"Slice of Pi with Neo-Excel"
Students explore diameter, radius, and circumference. They define radius, diameter, and circumference on an online dictionary, identify objects in the room with a radius and a diameter, and calculate the radius and diameter of various...
Curated OER
What Are The Risks From Radon?
Students examine the health risks of radon in the home. They calculate the odds for each risk and use different forms of measurement. They work together to complete the activity and worksheet.
Curated OER
My Hero -- A Class Mural
Young scholars discuss what heroism means to them. They create a black and white mural of a hero. They also research the hero's life and write about them.
Curated OER
"Checking In"
Students examine the checkpoints along the Iditarod Trail. They calculate the distances, mean and medians between each checkpoint. Using the internet, they follow along a virtual trail. They answer questions about when it would be more...
Curated OER
Musher Graphing and Probability
Young scholars use the internet to research statistical information on the musher dogs participating in the Iditarod. Using the data, they create three different types of pie charts. They use the charts to answer questions about the...
Curated OER
Estimation and Pattern Discovery
Students collect sunflower heads from their community garden. They estimate its seed count using different strategies. They graph their estimations on a graph and use calculators to find the actual total.
Curated OER
Shaking Hands
Students use diagrams or lists to show relationships. They also identify the pattern of triangular numbers. The mathematics behind situations provide a way of problem solving to examine the answers.
Curated OER
Around and Around
Students create a spreadsheet to record information about circular objects. They measure and record information from a variety of objects. Students calculate the ratio of the circumference to the diameter of each object. They find the...
Curated OER
Navigation, Working With Coordinates
Middle schoolers view a polar view map and discuss ways of telling locations on the map. They view a copy of the map superimposed on a coordinate grid, then discuss ways of telling the locations. Students practice as a class and then...
Curated OER
CSI Clamshell Investigation
Students explore predator/prey relationships. They research information on moon snails and claims. Students draw conclusions from the data collected. They use math and graphing to determine if there is a relationship to the clam's size...
Curated OER
Min-Max temperatures
Learners investigate data of minimum and maximum weather temperatures over the period of one week. They answer guided questions in order to establish comprehension of interpreting the data.
Curated OER
Track's Slippery Slope
Learners graph data of sports figure running time using x-axis y-axis to find slope of trend line, mathematically find the interpolated and extrapolated values for data points. Using the information they make predictions.
Curated OER
Mathematics Within: Algebraic Patterns
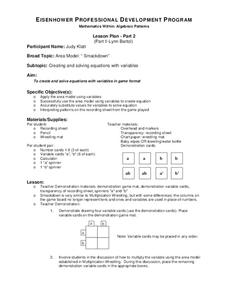
Students analyze problem solving techniques for equations with variables by playing a game called "Smackdown". They place variable cards on a grid and use the area model to calculate an answer after spinning a game piece to determine the...
Curated OER
Parts Per Million
Students perform serial dilution of food coloring experiment with partner, examine concentration levels, and differentiate parts per million (PPM) and parts per billion (PPB). Students complete pre-lab and post-lab questions and data table.
Curated OER
Emissions Trading
Students produce manufactured good, barter for sales, encounter government officials, make choices about emissions, trade carbon credits and share findings in order to understand how carbon trading could affect industry from an economic...
Other popular searches
- Graphing Ordered Pairs
- Ordered Pairs
- Coordinate Points
- Graphing Coordinates
- Coordinate Pairs
- Vowel Pairs
- Pairs of Homonyms
- Plotting Ordered Pairs
- Factor Pairs
- Base Pairs
- Angle Pairs
- Christmas Ordered Pairs


