Curated OER
Light Beam
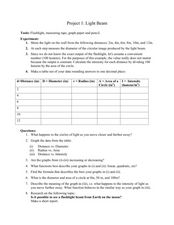
Students measure and convert between units. For this geometry lesson, students investigate through measurements of distances. They relate the properties of circle to solving problems with radius, diameter and area.
Curated OER
Time Trials
Students investigate speed, time and distance. In this algebra lesson, students utilize their knowledge of linear equations to solve problems related to time, speed and distance. This assignment is hands on using two toy race cars.
American Statistical Association
Scatter It! (Predict Billy’s Height)
How do doctors predict a child's future height? Scholars use one case study to determine the height of a child two years into the future. They graph the given data, determine the line of best fit, and use that to estimate the height in...
American Statistical Association
Scatter It! (Using Census Results to Help Predict Melissa’s Height)
Pupils use the provided census data to guess the future height of a child. They organize and plot the data, solve for the line of best fit, and determine the likely height and range for a specific age.
American Statistical Association
How Tall and How Many?
Is there a relationship between height and the number of siblings? Classmates collect data on their heights and numbers of brothers and sisters. They apply statistical methods to determine if such a relationship exists.
101 Questions
Retina Display
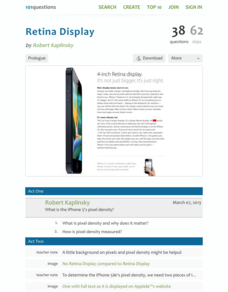
Learners calculate the pixel density of a specific cell phone using the concept of similarity. They use information from the cell phone's website to make their calculations and then compare their results to the posted information.
Curated OER
Birds' Eggs
More than just data, scatter plots are full of information that can be used to answer a variety of questions. This lesson uses a plot with information about bird egg sizes to answer questions about the relationship between length and...
Curated OER
The Gum Drop
Students find the area of three figure by the traditional formulaic methods. Then they count the number of grid squares to double check. They show an intuitive sense of Pick's Algorithm by counting every two boundary squares as one unit....
Illustrative Mathematics
Floor Plan
A multi-step problem has learners finding the actual area based on a scale drawing and then converting units at the end. Two different solution choices are listed depending on the preference on which step to start first. Both methods can...
Curated OER
Interpreting and Displaying Sets of Data
Students explore the concept of interpreting data. In this interpreting data lesson, students make a line plot of themselves according to the number of cubes they can hold in their hand. Students create their own data to graph and...
Shodor Education Foundation
Graphing and the Coordinate Plane
Ready to introduce your class to the coordinate plane? This website includes a detailed lesson plan that includes two interactive games to help learners practice graphing ordered pairs. The scripted discussion is a little cheesy and a...
Curated OER
Gridding a Site
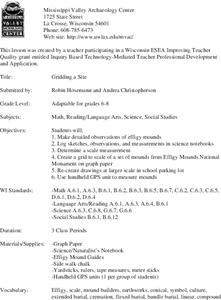
Learners make observations of effigy mounds and record them in a notebook. In groups, they must determine the scale of measurement and create their own grid to scale part of the Effigy Mounds National Monument. They also practice using...
Curated OER
Standard Sizes of Paper
Middle schoolers measure the dimensions of different sizes of paper. Using a copy machine, they discover dilations. After enlarging and shrinking particular copies, students examine rates, ratios and percentages and discover the...
Curated OER
Go the Distance
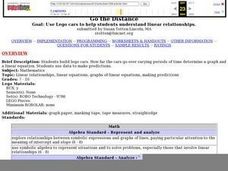
Students work together to build lego cars. They make predictions about how fast they believe the cars will go. They record their observations and discuss their results.
Curated OER
Building A Nation
Students build their own nation in groups where they create a name, flag, declaration of independence, form of government, mathematical layout, and more. In this nation lesson plan, students also provide a scale drawing of their nation...
Curated OER
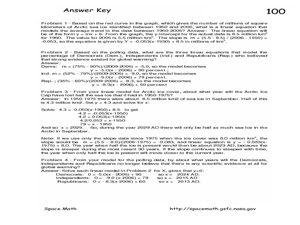
The Global Warming Debate and the Arctic Ice Cap
In this global warming and the Arctic ice cap worksheet, students use two graphs showing data about the amount of Arctic sea ice between 1950 and 2006 and the percent of people surveyed that believe the Earth has gotten warmer over the...
Curated OER
Rational Numbers
Young scholars investigate rational numbers in this algebra lesson. They graph systems of equations and use technology to find the point of intersection. They need a TI for this assignment.
Curated OER
Scatterplots and Regressions
In this scatterplots and regressions activity, students solve 6 different types of problems related to graphing scatterplots and interpreting regressions. First, they create a scatterplot from the given data coordinates and then,...
Curated OER
Reading Graphs
Students practice plotting functions on the Cartesian coordinate plane, see several categories of functions, including lines and parabolas, and read a graph, answering questions about the situation described by the graph
Curated OER
Reading Graphs
Students plot functions on the Cartesian coordinate plane. They explore lines and parabolas. Students analyze graphs and answer questions about the information presented on the graph using an online program.
Curated OER
What Are The Chances
Students calculate the probability of an event occurring. In this probability instructional activity, students differentiate between independent, dependent or compound events. They find the range of the data.
Curated OER
The Quadratic Formula
Students solve quadratic function by completing the square. In this algebra lesson plan, students use the quadratic formula to factor quadratics and find the roots. They graph the parabola and identify its properties.
Curated OER
Graphing System of Equations
Students solve system of equation. In this algebra lesson, students graph, substitute and eliminate to solve system of equation. They identify the point of intersection and how many solution each system will have.
Alabama Learning Exchange
The State Capital of Stem and Leaf
Students explore the concept of stem and leaf plots. In this stem and leaf plots lesson, students plot the 50 US states' capitals on a stem and leaf plot according to the first letter of each state. Students compare their stem and leaf...


