Illustrative Mathematics
High School Graduation
An exercise in finding the approximate time that a name would be called at a graduation. Estimating time may be difficult for some of the class, so this resource would not be a good choice for learning this standard. It does end with a...
Curated OER
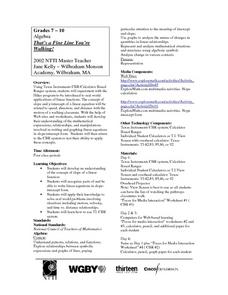
That's a Fine Line You're Walking!
Students experiment with Hiker program to practice real world applications of linear functions and develop their understanding of expressions, relationships, and manipulations involved in writing and graphing linear equations in...
Curated OER
CHOREOGRAPHING MATH
Students graph linear equations and choreograph dance moves to demonstrate them.
Curated OER
Strike a Pose: Modeling in the Real World (There's Nothing to It!)
Adjust this lesson to fit either beginning or more advanced learners. Build a scatter plot, determine appropriate model (linear, quadratic, exponential), and then extend to evaluate the model with residuals. This problem uses real-world...
Mathematics Assessment Project
Expressions and Equations
Express your wonder at this resource. Middle schoolers solve 10 short problems in the expressions and equations domain. They apply operations with scientific notation, set up and solve equations, and analyze linear equations.
Curated OER
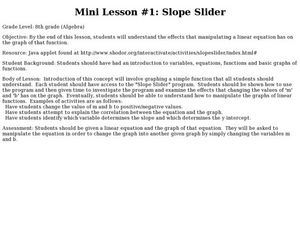
Mine Lesson #1: Slope slider
Eighth graders investigate linear equations. In this Algebra I lesson, 8th graders explore the effects that manipulating a linear equation has on the graph of the function through the use of a java applet.
University of California
Student Workbook: Algebra I
Need a helping hand in Algebra I? How about a giant, super-sized worksheet packet? Here is a resource that has worksheets for virtually every concept with some accompanying examples.
Mathematics Assessment Project
Creating Equations
Using equations to model events. The resource contains four items that prompt individuals to write and solve basic equations. They must reason abstractly and quantitatively while attending to precision when solving the problems.
Shodor Education Foundation
Function Flyer
Fly through graphing functions with the Function Flyer. Young mathematicians use an interactive to graph different types of functions. A set of exploration questions has users investigate patterns in functions.
Newspaper Association of America
By the Numbers: Mathematical Connections in Newspapers for Middle-Grade Students
A cross-curricular resource teaches and reinforces mathematical concepts with several activities that use parts of a newspaper. Scholars use scavenger hunts to find the different ways math is used in the paper along with using data...
Charleston School District
The Line of Best Fit
If it's warm, they will come! Learners find a line of best fit to show a relationship between temperature and beach visitors. Previous lessons in the series showed pupils how to create and find associations in scatter plots. Now, they...
Curated OER
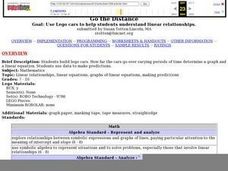
Go the Distance
Students work together to build lego cars. They make predictions about how fast they believe the cars will go. They record their observations and discuss their results.
Curated OER
Exploring Equations and Y-Intercept
Students graph linear equations using intercepts, find y-intercept, find x-intercepts and graph linear equations that use horizontal and vertical lines.
Curated OER
Reading Graphs
Students plot functions on the Cartesian coordinate plane. They explore lines and parabolas. Students analyze graphs and answer questions about the information presented on the graph using an online program.
Curated OER
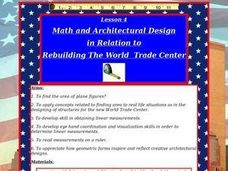
Math and Architectural Design in Relation to Rebuilding The World Trade Center
Students discover building plans and practice reading measurements. In this architectural design lesson, students investigate the areas of the specific World Trade Center locations that need to be rebuilt and determine the cost....
Curated OER
Correlation of Variables by Graphing
Middle and high schoolers use a spreadsheet to graph data. In this graphing lesson plan, learners determine how two parameters are correlated. They create a scatter plot graph using a computer spreadsheet.
Curated OER
Does Order Really Matter?
Investigate the order of operations! Learners participate in interactive multi-media activities to examine and solve multi-step equations, inequalities. They evaluate formulas and simplify monomials and polynomials.
Curated OER
Optimization For Breakfast
Students identify he proportion of a cereal box. In this algebra lesson, students define the relationship between patterns, functions and relations. They model their understanding using the cereal box.
Curated OER
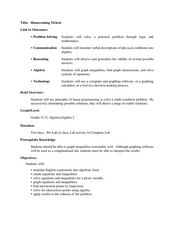
Homecoming Tickets
Students solve word problems using systems of equation. In this algebra lesson, students use computer and graphing to graph and analyze their solution. They solve system involving inequalities.
Curated OER
Students Analyze Data With Scatter Plots
Scatter plot lessons can help students create different types of graphs by hand or with the aid of technology.
Curated OER
The International Space Station-Follow that Graph!
In this altitude change of the International Space Station worksheet, students observe a graph of the change in altitude of the space station over time due to the Earth's drag. Students solve 3 problems using the data in the graph.
Curated OER
Conductivity of salt Solutions
Learners investigate the concentration level of solutions. In this math/science instructional activity, students identify three different ionic compounds. They predict the conductivity of each using their collected data.
Curated OER
Let's Go Slopey
Young scholars create a table of values to graph a line. In this algebra lesson, students identify the slope and intercept of a linear equation. They use a Ticalculator to graph their function.
Curated OER
Topic 6: Evaluating and Presenting Results
Students construct spreadsheets from raw data. In this spreadsheet construction lesson, students compile data into Microsoft Excel. Students familiarize themselves with entering and presenting data in a spreadsheet.
Other popular searches
- Linear Programming Problems
- Linear Programming Algebra 2
- Linear Programming Projects
- Algebra Linear Programming
- Math Linear Programming
- Linear Programming Lecture
- Linear Programming Music
- Complex Linear Programming
- Linear Programming + Music


