EngageNY
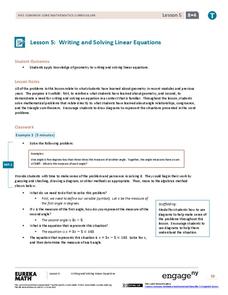
Writing and Solving Linear Equations
Incorporate geometry into the solving linear equations lesson. Pupils use their knowledge of geometry to write linear equations which reinforces geometry measurement concepts while at the same time providing a familiar context for...
Curated OER
Solar Kit Lesson # 12 - Calibration Curve for a Radiation Meter
Scientists need to have mastered algebraic slope-intercept concepts in order for this lesson to be effective. They will measure and graph solar panel output as a function of the amount of radiation striking it, discovering that there is...
Curated OER
Let's Get Linear
Math whizzes utilize spreadsheets to examine linear modeling. They roll marbles down a ramp from three different heights and measure how far they roll. They use Excel to record their data and create a plot of their data.
Project Maths
Inequalities
Which number is bigger? Using a variety of activity sheets, this unit starts with the basics of inequalities and progresses through solving compound linear inequalities. Problems cover the range of inequalities including inequality word...
West Contra Costa Unified School District
Solving Inequalities
What does translating points on a number line have to do with solving inequalities? Young mathematicians first learn about translations of points on a number line, and then use this information to solve linear inequalities in one variable.
Curated OER
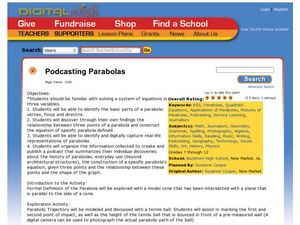
Podcasting Parabolas
Students explore parabolas. In this algebra and technology instructional activity, students construct the equation of a specific parabola, then take digital photos of real-life representations of these parabolas. Students create a...
Utah Education Network (UEN)
Linear Graphs Using Proportions and Rates
Using a TI-73 or other similar graphing calculator middle school math majors investigate the linear relationship of equivalent proportions. After a brief introduction by the teacher, class members participate in a timed pair share...
Curated OER
A Special Relationship
Students discover the relationships of the lengths of the sides of right triangles and right triangles using a series of drawings on dot paper. They investigate and solve problems of standard (customary and metric units) and non-standard...
101 Questions
Styrofoam Cups
How many cups does it take to reach the top? Learners attempt to answer this through a series of questions. They collect dimension information and apply it to creating a function. The lesson encourages various solution methods and...
Curated OER
Linear Functions
Students solve and graph linear equations. In this algebra instructional activity, students collect data and plot it to create a linear function. They identify the domain and range of each line.
Curated OER
Iterating Linear Functions
Learners use a spreadsheet to investigate data. In this algebra lesson, students collect and graph data on a coordinate plane. They explain properties of a linear equation both algebraically and orally.
Curated OER
Lines, Lines, Everywhere
Students explore linear equation suing real life scenarios. In this algebra instructional activity, students find the slope and intercept of a line. They create table of values to plot their graph and draw conclusions.
Charleston School District
The Sum of Angles in a Triangle
An informative lesson contains a brief explanation of how the sum of the angles of a triangle is a line. The lesson continues with determining the missing angle in a triangle, or solving for a variable. Using the sum of the angles, the...
EngageNY
The Slope of a Non-Vertical Line
This lesson introduces the idea of slope and defines it as a numerical measurement of the steepness of a line. Pupils then use the definition to compare lines, find positive and negative slopes, and notice their definition holds for...
Curated OER
How Do They Relate? Linear Relationship
Young scholars collect information and use a line to represent it. In this algebra lesson, students investigate real world data to see if it makes a line. They graph the line comparing the relationship of the x axis with that of the y axis.
Curated OER
Beginning Modeling for Linear and Quadratic Data
Young scholars create models to represent both linear and quadratic equations. For this algebra lesson, students collect data from the real world and analyze it. They graph and differentiate between the two types.
Curated OER
Comparison of Two Different Gender Sports Teams - Part 1 of 3 Measures of Central Tendency
Students gather and analyze data from sports teams. In this measures of central tendency instructional activity, students gather information from websites about sports team performance. Students analyze and draw conclusions from this...
Curated OER
Slopes and Linear Equations
Students find the slopes of linear functions. In this graphing lesson, students analyze linear equations and calculate the slope of the line. They graph a line given the slope and y-intercept.
EngageNY
Conversion Between Celsius and Fahrenheit
Develop a formula based upon numerical computations. The 31st part of a 33-part unit has the class determine the formula to convert a temperature in Celsius to a temperature in Fahrenheit. They do this by making comparisons between the...
Curated OER
It's a Drag!
Students create number lines using decimals and whole numbers. In this algebra lesson, students graph and solve linear equations. They plot ordered pairs on a coordinate plane correctly.
Curated OER
The UPS Experiment
Pupils calculate the speed using metric measurements. In this geometry lesson, students calculate speed, distance and velocity using metric measurements. They gain inquiry and problem solving skills in this assignment.
Curated OER
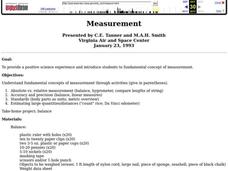
Measurement
Students experience a positive science experiment and study fundamental concepts of measurement.
Curated OER
Correlation of Variables by Graphing
Middle and high schoolers use a spreadsheet to graph data. In this graphing lesson plan, learners determine how two parameters are correlated. They create a scatter plot graph using a computer spreadsheet.
Curated OER
Real-World Linear Equations
Eighth graders practice technology skills through the use of a spreadsheet and a discovery lesson plan focusing upon linear equations. The technology allows for the visual changes to be displayed for different lines of equations.


