Curated OER
Spreadsheet Function Machine
Learners create a spreadsheet to analyze functions. For this algebra lesson, students use spreadsheets to find the intersection of systems of equations. They identify the dependent and independent function as it relates to a line.
Sri Atmananda Memorial School
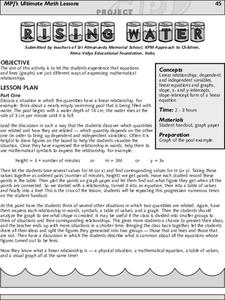
Rising Water
An engaging, and not to mention attractive, lesson plan has prealgebra and beginning algebra scholars examining linear relationships. They consider the rising water level as a swimming pool is being filled. They do so by charting and...
Curated OER
How Long Can You Go?
Eighth graders examine the usefulness of a line of best fit by collecting and graphing data, using a graphing calculator to determine the line of best fit, and making a variety of predictions. They watch a video, then design a...
02 x 02 Worksheets
Inverse Variation
Discover an inverse variation pattern. A simple lesson plan design allows learners to explore a nonlinear pattern. Scholars analyze a distance, speed, and time relationship through tables and graphs. Eventually, they write an equation to...
Curated OER
Solving Multi-Step Inequalities
Ready to study inequalities with your class? Use this worksheet to solve multi-step inequalities and graph the solutions. The document would be great to use as a study guide as you present the material, or could easily be modified and...
Curated OER
Race The Rapper: Slopes
Students calculate the slope of the equation In this algebra instructional activity, students graph coordinate pairs of linear equations and identify the relationship between x and y values and slope. They differentiate between...
Curated OER
The Absolute Truth
Students solve problems of inequalities and equations. For this algebra lesson, students add, subtract, multiply and divide to solve inequalities. They graph their solutions on a number line.
Curated OER
A Study of a Quadratic Function
Young scholars factor and solve quadratic equations. In this algebra lesson, students play a game as the collect and graph data. they identify properties of their parabola and make predictions.
Curated OER
Slope Y-intercept Quiz
In this algebra worksheet, students identify the slopes and y intercept of a line. They complete the quiz,by graphing and identify linear equations. There are 6 questions with an answer key.
Curated OER
Can we Predict Differences?
Students differentiate between linear and non-linear graphs. In this algebra lesson, students investigate slopes as it relates to a function using graphs of linear and non-linear equations. They collect data using the TI to graph...
Curated OER
Time Trials
Students investigate speed, time and distance. For this algebra lesson, students utilize their knowledge of linear equations to solve problems related to time, speed and distance. This assignment is hands on using two toy race cars.
Curated OER
Walking Home
Students discover the formulas for calculating distance. In groups, they solve equations determine the distance in a specific amount of time. They record their answers in a chart or graph and compare them with their classmates.
Virginia Department of Education
Determining Direct Variation
Once learners realize what direct variation is, they see it's just a type of linear function. The lesson plan poses a general question that leads to the creation of the y = kx formula. The resource includes discussion prompts and ideas...
Illustrative Mathematics
Kimi and Jordan
Kimi and Jordan have taken summer jobs to supplement their weekly allowances. Kimi earns more per hour than Jordan, but Jordan's weekly allowance is greater. This activity asks students to determine how the incomes of the two workers...
Mathematics Vision Project
Module 8: More Functions, More Features
A piece of this and a piece of that, add domain restrictions and create a piecewise function. Young scholars explore piecewise functions with and without context. Functions include both linear and quadratic parts. The module is the...
Curated OER
Impossible Graphs
Students distinguish between possible and impossible graphs of functions, and to learn why some graphs are impossible. They have practiced plotting functions on the Cartesian coordinate plane
Curated OER
Review for the Algebra One SOLs
Students review the standards for Algebra I. Using the text, they discover two problems that match each standard and solve them showing all steps on paper. They create a PowerPoint slide for each problem and go through the correct...
Curated OER
Bubble Gum Chemistry
Students explore the concept of graphing data. In this graphing data lesson, students determine the percentage of sugar in bubble gum. Students graph type of gum vs. sugar percentage. Students create a table of their data.
Curated OER
What's Its Slope
Students identify the slope of a lines.In this algebra lesson, students define the meaning of slope and write an equation given the slope. They graph linear functions using the slope and y-intercept.
Curated OER
Geometry: Parallel and Perpendicular Lines
This basic handout would be good for skills practice or a review of parallel and perpendicular lines. Review the definitions, then practice writing equations of lines that pass through a specific point and are either parallel or...
Curated OER
Inquiry Unit: Modeling Maximums and Minimums
Young mathematicians explore the maximun area for patio with the added complexity of finding the mimimum cost for construction. First, they maximize the area of a yard given a limited amount of fence and plot width v. area on a...
Virginia Department of Education
The Submarine
Submerge yourself in the study of slope. Scholars investigate a situation involving slope and the rate of change of a submarine. An additional example further explores the concept of slope by changing one of the conditions of the submarine.
Curated OER
Introductory Algebra Chapter 8 Review
In this math worksheet, students solve the problems that are correlated with the objectives. Each practice set has an in depth example.
Curated OER
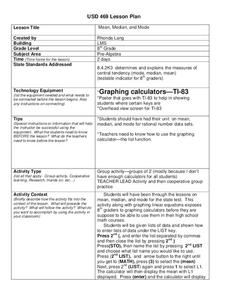
Mean, Median, and Mode
Eighth graders practice using the LIST key on graphing calculators using the proper syntax. They work with the functions of mean, median, and mode in a teacher led instructional activity and then with a partner on a second data set. They...

