EngageNY
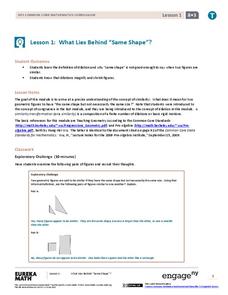
What Lies Behind “Same Shape”?
Develop a more precise definition of similar. The lesson begins with an informal definition of similar figures and develops the need to be more precise. The class learns about dilations and uses that knowledge to arrive at a mathematical...
Curated OER
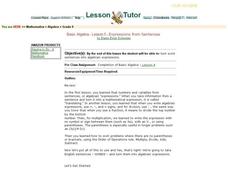
Expressions from Sentences
In this algebra worksheet, students rewrite sentences into algebraic equations using variables and solve for the unknown. There are 10 interactive questions with an answer key.
Curated OER
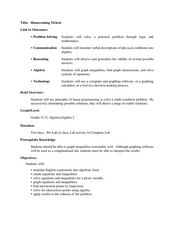
Homecoming Tickets
Students solve word problems using systems of equation. In this algebra lesson, students use computer and graphing to graph and analyze their solution. They solve system involving inequalities.
Curated OER
Slippery Slope
Learners define patterns, relation and function. In this algebra lesson, students find the slope of a line and write equations of line. They model the slope using real life scenarios.
Curated OER
Relating Distance and Velocity Over Time
Students calculate the distance and velocity over time. For this algebra lesson, students graph a linear function to represent the distance vers time travel. They interpret their graphs and draw conclusion.
Curated OER
The Sum of Our Integer Intelligences
Young mathematicians explore integers. They review adding integers through engaging in mathematical labs. Each lab station is designed to reflect one of the multiple intelligences. Resources for all activities are provided.
Curated OER
Interpreting Graphs
Sixth graders interpret linear and nonlinear graphs. They create graphs based on a problem set. Next, they represent quantitive relationships on a graph and write a story related to graphing.
Curated OER
Adding and Subtracting Integers
Students add and subtract integers. In this algebra lesson, students add, subtract, multiply and divide integers. They apply the properties of numbers as they solve equations.
Curated OER
Adding/Subtracting Decimals
In this decimal learning exercise, students find the sum and difference of positive and negative decimal numbers. Equations contain two to three terms, with multiple operations. Thirty addition and subtraction problems are on this...
Curated OER
Solve Me-One and Two-Step Inequalities
Students solve one and two-step inequalities. For this Algebra I lesson, students solve inequalities using paper and pencil and use the TI-nspire CAS to check each steps in their work. Additionally, the solve feature will be used to...
Curated OER
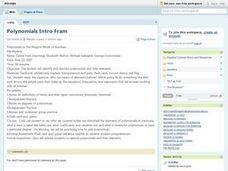
Polynomials in The Magical World of Numbers
Young scholars identify and describe polynomials and their elements, discuss simple parts that make up equations, inequalities, and exponents, take notes on definitions of terms and their types, including monomials, binomials, and...
Curated OER
Graphing Inequalities
Students graph inequalities on a number line and discuss how to solve for one variable. The teacher models examples as students take notes. In groups, students participate in an activity to demonstrate inequalities on a number line. ...
Curated OER
Exponents III- Squares and Square Roots
Young scholars explore the process of inverse operations to solve square root problems. After exploring the perfect squares and area, students examine methods to find square roots by observing the teacher, taking notes, and listing...
Curated OER
Graphing Linear Inequalities
Eighth graders extend skills for representing and solving linear equations to linear inequalities. Lesson activities build understanding and skill by plotting ordered pairs of numbers that either satisfy or do not satisfy a given...
Curated OER
Choosing a Summer Job
What did you do over your summer vacation. Young wage earners must compare summer job options, and determine when each job earn the same amount and what that amount be. This be done by creating, graphing, and solving systems of...
Curated OER
Direct and Inverse Variation
Eighth graders participate in two data collection activities that involve direct and inverse variation. In the pre-assessment, 8th graders categorize numerical, graphical, and verbal representations as linear or nonlinear and determine...
Curated OER
Race The Rapper: Slopes
Young scholars calculate the slope of the equation In this algebra lesson, students graph coordinate pairs of linear equations and identify the relationship between x and y values and slope. They differentiate between functions and...
Curated OER
What's My Rule? Simple Linear Functions
Students investigate simple linear functions by trying to guess a function rule from inputs and outputs. They write the function rule in algebraic form.
Curated OER
The Sum of Our Integer Intelligences
Students complete tasks. In this Seven Intelligences lesson, students complete a variety of activities that are all based on the seven different intelligences humans are supposed to possess based on Dr. Gardener's theory. They work in...
Curated OER
How High Are the Clouds?
Students analyze height and collect data to create a graph. In this statistics lesson, students use central tendencies to analyze their data and make predictions. They apply concept of statistics to other areas of academics to make a...
Curated OER
Starting With Stats
Statisticians analyze a data set of student IQs by finding measures of central tendency and dispersion such as mean, median, mode, and quartiles. They practice using a graphing calculator to find the values and analyze box plots and...
Center of Excellence for Science and Mathematics Education
A Sick Astronaut
Aspiring astronauts graph, interpret, and analyze data. They investigate the relationship between two variables in a problem situation. Using both graphic and symbolic representations they will grasp the concept of line of best fit to...
Curated OER
Inequalities - Absolute Value
Students graph the absolute value of compound inequalities. Through a demonstration, students discover the meaning of absolute value. They take notes, rewrite opposites, and solve for each variable. Students complete a worksheet and...
Curated OER
Is there Treasure in Trash?
More people, more garbage! Young environmentalists graph population growth against the amount of garbage generated per year and find a linear model that best fits the data. This is an older resource that could benefit from more recent...
Other popular searches
- Pre Algebra Equations
- Pre Algebra Solving Equations
- Pre Algebra Equations
- Pre Algebra Graphing Lines


