Curated OER
Math: Football Fever Fun
Pupils compile statistics from high school or other football team and construct a spreadsheet on which to record their findings. Using Chart Wizard to analyze the data, they construct charts and graphs for a visual display of the...
Curated OER
Probability Two Events
Students investigating the concept of probability practice the concept using a variety of different example problems. The lesson is delivered in a question and answer format. The frequency of answers is recorded in a data table for...
Curated OER
Long Distance Phone Plans
In this long distance phone plane worksheet, students compare various phone plans and determine which long distance plan has the greatest savings. Students support their answers visually through the use of tables and graphs. They write...
National Museum of Nuclear Science & History
Nuclear Popcorn
Make your lesson on radioactive decay pop with this lab exercise. Using popcorn kernels spread over a tabletop, participants pick up all of those that point toward the back of the room, that is, those that represent decayed atoms. As the...
Curated OER
What Can I Afford?
Students explore the concept of cell phone plans. In this cell phone plan lesson, students research the cost of cell phones. Students compare various cell phone plans and decide on which phone plan is best for them.
Curated OER
Linear Equations Data Tables
Students graph linear equations on a Cartesian plane. After describing data tables and their use, students explore how the information from a table can be used to create a line graph. They discuss reasons for plotting a minimum of...
Curated OER
Graphing Linear Equations Using Data Tables
Pupils review the Cartesian plane and the process of plotting points. In groups, students create tables, identify the slope and y-intercept, and graph the equation. Afterward, pupils perform the same process, only, individually. As a...
Curated OER
Data Analysis
Learners double check their data collections of Top 20 singles that they've been collecting for several days. Types of data is reviewed in detail and a variety of questions are asked for retention factors of mastery. They draw a tally...
Curated OER
In A Heartbeat
Students discuss scatter plots then create a class scatter plot using their heart rate at rest and their heart rate after a few minutes of aerobic exercises. Students copy the points plotted as a class and create individual graphs...
Curated OER
Fishing for Points
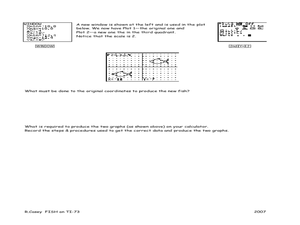
Learners explore the concept of ordered pairs. In this ordered pairs lesson, pupils list the ordered pairs of a graph in the shape of a fish. They use their calculator to translate the fish using lists, then translate the fish left,...
Illuminations
Circumference and Areas of Circles
Middle and high schoolers listen to a scenario about a puppy and use the scenario to develop formulas in order to find the area of a circle. In this circumference lesson, pupils understand how to find the radius, diameter, area of a...
Curated OER
Students Analyze Data With Scatter Plots
Scatter plot lessons can help students create different types of graphs by hand or with the aid of technology.
Curated OER
Great Lakes Homepage for Kids
Here are some outstanding lessons on the geology and history of the Great Lakes. These lessons are divided into Grade 4 -6, and Grade 7 - 8 activities. The activities all use the background information, maps, graphs, data, and Great...
Mathalicious
Domino Effect
Carryout the lesson to determine the cost of pizza toppings from a Domino's Pizza® website while creating a linear model. Learners look through real data—and even create their own pizza—to determine the cost of each topping. They explore...
Scholastic
Study Jams! Choosing the Correct Graph
With so many types of graphs, don't let your learners get stuck figuring out which one to use. To track how Zoe spent her allowance, use this interactive lesson to review all the types of graphs and pick the best one to display the data....
Charleston School District
Pre-Test Unit 9: Scatter Plots
What do your classes know about statistics? Use a pre-test to determine their background. Topics include scatter plots and lines of best fit, two-way frequency tables, and modeling with linear equations.
Curated OER
Monster Cars: Slope
Students examine how a rate is calculated from two points. Using battery operated cars, pairs of students measure time and distance. Afterward, they use this data to calculate the rate. Students then plot four ordered pairs and discover...
Curated OER
Animal Brains
Do big bodies make big brains? Let your learners decide whether there is an association between body weight and brain weight by putting the data from different animals into a scatterplot. They can remove any outliers and then make a line...
Curated OER
Birds' Eggs
More than just data, scatter plots are full of information that can be used to answer a variety of questions. This lesson uses a plot with information about bird egg sizes to answer questions about the relationship between length and...
Concord Consortium
Center of Population
Let the resource take center stage in a lesson on population density. Scholars use provided historical data on the center of the US population to see how it shifted over time. They plot the data on a spreadsheet to look the speed of its...
Curated OER
Writing Linear Equations in Different Forms
Can your class write linear equations three different ways? Here is a study guide that includes slope-intercept, standard, and point-slope forms. Learners are given the slope and a point on the line, or two points and are asked to write...
Illustrative Mathematics
Heads or Tails
Heads! A great way to practice probability is to flip a coin in class. The provided data allows your mathematicians to predict the probability of heads in ten coin flips. Bring coins to class and allow your own trial of heads or tails....
Charleston School District
Increasing, Decreasing, Max, and Min
Roller coaster cars traveling along a graph create quite a story! The lesson analyzes both linear and non-linear graphs. Learners determine the intervals that a graph is increasing and/or decreasing and to locate maximum and/or minimum...
Mathed Up!
Two Way Tables
When presented with categorical data, a two-way frequency table is a great way to summarize the information. Pupils organize categorical data using a two-way table, then use the tables to determine missing data and to calculate simple...


