Bowland
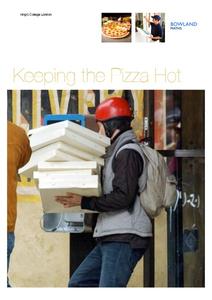
Keeping the Pizza Hot
Learners conduct an experiment to develop a cooling curve for pizza. They consider how this affects pizza delivery in terms of packing material, distance, and delivery routes.
Alabama Learning Exchange
The State Capital of Stem and Leaf
Students explore the concept of stem and leaf plots. For this stem and leaf plots lesson, students plot the 50 US states' capitals on a stem and leaf plot according to the first letter of each state. Students compare their stem and...
Curated OER
Statistics
In this statistics instructional activity, students view 6 graphs to determine the correlation. Students then answer 4 questions that involve plotting data, determining a relationship, and making predictions.
Curated OER
Lessen the Loan
Middle-schoolers explore the concept linear equations. They use the internet to navigate through videos and problems. Pupils problem solve to determine rates of change, slope, and x and y-intercepts.
Curated OER
Reaching New Heights
Pupils explore the relationship between two variables. Students measure their arm span and height. They gather this class data to design a scatter plot. Pupils interpret the meaning of individual coordinates and the overall graph. ...
Curated OER
Graphs
In this graphs learning exercise, students solve and complete 9 various types of problems. First, they use a large scatter graph to complete a described trend in data. Then, students find the difference of negative numbers and place them...
Curated OER
Statistics
In this statistics activity, students solve and complete 2 different problems that include using statistics. First, they use the scatterplot shown to determine the value of x that best matches the expression. Then, students determine the...
Curated OER
Scatterplots
In this scatterplots learning exercise, students construct a scatter plot from a given data set. Students then answer 4 questions regarding the least-squares regression line and making predictions.
Curated OER
VARIABLES AND PATTERNS, USE AFTER INVESTIGATION THREE. DISCRETE OR CONTINUOUS LINEAR RELATIONS.
Learners discover for which kind of linear function is appropriate to use the "scatter" or the "connected" term. In this lesson, students investigate functions using variables, patterns book, graph paper, rulers and the graphit program.
Curated OER
Height versus Shoe Size
Middle schoolers find a correlation between a person's height and his/her shoe size. They have access to entering data into lists on a graphing calculator and can complete scatter plots. Students read and interpret a scatter plot and use...
Curated OER
Linear Modelling of the Life Expectancy of Canadians
Middle and high schoolers explore the concept of linear modelling. In this linear modelling lesson, pupils find the line of best fit for life expectancy data of Canadians. They compare life expectancies of men and women, and find the...
Curated OER
What Pie?
Students practice making and interpreting pie graphs so they are better able to decide if a pie chart is the appropriate form of display. Students examine included overheads of different pie charts, and directions on how to make pie...
Curated OER
What Can Scatterplots Tell Us?
Eighth graders use data from surveys conducted with parents, peers and themselves to create computer-generated scatterplots. They make inferences from their scatterplots.
Curated OER
Strike a Pose: Modeling in the Real World (There's Nothing to It!)
Adjust this lesson to fit either beginning or more advanced learners. Build a scatter plot, determine appropriate model (linear, quadratic, exponential), and then extend to evaluate the model with residuals. This problem uses real-world...
Curated OER
Scientific Observation of Force and Acceleration on an Object
In this force and acceleration worksheet, 8th graders answer ten questions based on two graphs. The first graph is a scatter plot, the second is a line graph.
Mathematics Assessment Project
Middle School Mathematics Test 3
Real-life mathematics is not as simple as repeating a set of steps; pupils must mentally go through a process to come to their conclusions. Teach learners to read, analyze, and create a plan for solving a problem situation. The provided...
Curated OER
Modeling Drug Assimilation in the Human Body
Students investigate the accumulation of drugs in the body. In this algebra lesson, students collect data on drug retention and assimilation. They use their data to predict the behavior and effects of drugs.
Curated OER
comparison of Two Gender Sports Teams
Students gather data on sports team and create a box and whisper plot. In this data collection lesson, students find the median, the quartile range, and relationships between variables.
Curated OER
Line of Best Fit
Young scholars identify the line of best fit. In this statistics lesson, students collect and analyze data. They calculate the regression equations and identify the different types of correlation.
Curated OER
Correlate This!
Students investigate different correlations. In this algebra lesson, students analyze graphs and identify the lines as having positive, negative or no correlation. They calculate the line of best fit using a scatter plot.
Curated OER
Batteries in Series
Eighth graders examine batteries in a series circuit and the associated voltage. They determine, through inquiry and problem solving, that the total voltage of batteries in a series is the sum of the voltage of each battery. They design...
Curated OER
Comparison of Two Different Gender Sports Teams - Part 1 of 3 Measures of Central Tendency
Students gather and analyze data from sports teams. In this measures of central tendency instructional activity, students gather information from websites about sports team performance. Students analyze and draw conclusions from this...
Curated OER
Black Out
Students collect and analyze data. In this statistics lesson plan, students plot their data on a coordinate plane and find the line of best fit. They calculate the linear regression using the data.
Curated OER
Conductivity of salt Solutions
Learners investigate the concentration level of solutions. In this math/science instructional activity, students identify three different ionic compounds. They predict the conductivity of each using their collected data.


