Curated OER
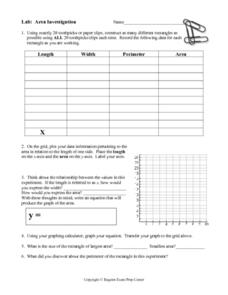
Area Investigation
In this area investigation worksheet, 8th graders solve and complete 6 different problems that include complete a chart with given data and a graph. First, they construct as many different rectangles as possible using toothpicks. Then...
Curated OER
Order of operations
In this order of operations worksheet, students solve problems involving addition, subtraction, multiplication, and division. Students complete 10 multiple choice problems.
Teach Engineering
The Fibonacci Sequence and Robots
What better way to introduce the idea of a sequence than with robots! An educational lesson explains the classic Fibonacci sequence before pupils build and program a robot to move. Additionally, the lesson challenges individuals to...
Curated OER
Writing Variable Expressions for Physical Models
Explore the concept of writing variable expressions by examining the similarities between expressions with numbers and expressions with variables. Emerging mathematicians determine rules for sequences and patterns before writing a rule...
Curated OER
A Special Relationship
Students discover the relationships of the lengths of the sides of right triangles and right triangles using a series of drawings on dot paper. They investigate and solve problems of standard (customary and metric units) and non-standard...
Curated OER
Curses and Re-Curses! It's Happening Again.
Students study basic recursion by exploring patterns in the data they generate from two simple probability-based experiments. In the first, students flip a coin to discover how many times they must flip it before it lands on "heads."...
Curated OER
Conductivity of salt Solutions
Learners investigate the concentration level of solutions. In this math/science instructional activity, students identify three different ionic compounds. They predict the conductivity of each using their collected data.
Curated OER
Hot Wheels
Students observe the action produced by toy cars. In this geometry lesson, students discuss motion and distance as they relate to the movement of a spherical object.They collect data and make conjectures based on their data.
Curated OER
Walking on Air
Students collect and analyze data with a graph. In this statistics instructional activity, students use central tendencies to find the meaning of their data. They display the data on a Ti calculator.
Curated OER
How High Are the Clouds?
Pupils analyze height and collect data to create a graph. In this statistics lesson, students use central tendencies to analyze their data and make predictions. They apply concept of statistics to other areas of academics to make a...
Curated OER
Let's Get Physical
Students collect data using the CBL. In this statistics lesson plan, students predict the type of graph that will be created based on the type of activity the person does. The graph represents heart rate depending the level of activity.
Curated OER
Does Music Cam the Savage Beast?
Students collect, graph and analyze data. In this statistics lesson, students measure the heart beat of a person as they listen to music. They use the CBL and TI to create a graph, analyzing the outcome.
Curated OER
How Much Is Too Much?
Students examine population growth and collect data. In this statistics lesson, students create a scatter plot to represent the different species found in the water and are being harvested. They graph their data and draw conclusion from it.
Curated OER
Function Tables
For this function tables worksheet, students analyze 6 different function tables to determine the rule that applies to each table. The data in the table involves 2 variables and the rule is either addition, subtraction, multiplication...
Curated OER
Cannonball
Students calculate the speed, motion and distance of a projectile. In this geometry lesson, students obtain measurements while calculating velocity. They graph their results and make predictions.
Curated OER
Identity and Equality Properties
In this math worksheet, students solve five problems, identifying each property as it is used. They identify the used property in 9 problems.
Virginia Department of Education
Middle School Mathematics Vocabulary Word Wall Cards
Having a good working knowledge of math vocabulary is so important for learners as they progress through different levels of mathematical learning. Here is 125 pages worth of wonderfully constructed vocabulary and concept review cards....
Curated OER
Interactivate: Introduction to Functions
This interactive website provides a variety of lesson plans according to which standards you are applying and which textbook you use. Introduce functions to your class by having them construct single operation machines and create...
Curated OER
Ratios and Proportions
This study guide would be great to use when presenting a lesson on ratios and proportions. It includes clear definitions, explanations, and examples to work through as a class or individually. In addition, it has notes on rates and...
Happy Maau Studios
Math Ref
Forgot how to multiply matrices? Well, this app can help. It is like a gigantic, well-organized reference card for all things math. Customize your personal reference material by adding your own notes and build up a personalized list of...
Curated OER
How Long Can You Go?
Eighth graders examine the usefulness of a line of best fit by collecting and graphing data, using a graphing calculator to determine the line of best fit, and making a variety of predictions. They watch a video, then design a...
Curated OER
Graphing Inequalities in Two Variables
This study guide is a great resource to help you present the steps to graphing linear inequalities. Show your class two different ways to graph an inequality and work on a real-world example together. The document could also be easily...
Virginia Department of Education
Determining Direct Variation
Once learners realize what direct variation is, they see it's just a type of linear function. The instructional activity poses a general question that leads to the creation of the y = kx formula. The resource includes discussion prompts...
Curated OER
Starting With Stats
Statisticians analyze a data set of student IQs by finding measures of central tendency and dispersion such as mean, median, mode, and quartiles. They practice using a graphing calculator to find the values and analyze box plots and...
Other popular searches
- Equations Pre Algebra
- Equations Prue Algebra
- Balancing Equations Algebra
- Addition Equations Algebra
- Literal Equations in Algebra
- System of Equations Algebra
- Pre Algebra Solving Equations
- Graphing Lines Algebra
- Pre Algebra Graphing Lines


