Curated OER
Reading Graphs
Students practice plotting functions on the Cartesian coordinate plane, see several categories of functions, including lines and parabolas, and read a graph, answering questions about the situation described by the graph
Curated OER
Fire!, Probability, and Chaos
Upper elementary and middle schoolers work with the concept of probability. They are introduced to the concept of chaos. Learners graph and analyze using a line plot, work with mean, and are introduced to the concept of variance.
Curated OER
Pizza Possibilities
Middle schoolers create and interpret line plots, bar graphs, and circle graphs. The lesson assumes mastery of conversions from fraction to decimal to percent, construction of angles, and at least an introduction to graphs displaying data.
Curated OER
Rational Function Graphs
Students use algebraic methods to represent and solve problems. Using a graphing calculator, students solve rational and inequality problems. They visually demonstrate solutions of functions through graphing. Students answer questions...
Shmoop
Box, Stem-Leaf, and Histogram
A helpful and versatile instructional activity requires young mathematicians to analyze data in order to create graphs and answer questions. Additionally, it prompts learners to find the mean, median, mode, and range of some of the data...
EngageNY
Mid-Module Assessment Task: Grade 7 Mathematics Module 3
Lesson 16 in the series of 28 is a mid-module assessment. Learners simplify expressions, write and solve equations, and write and solve inequalities. Most questions begin as word problems adding a critical thinking component to the...
Mathematics Assessment Project
Middle School Mathematics Test 6
A thorough math test divides the content into two 40-minutes sections, covering material through algebra and geometry. Problems incorporate analysis and applied problem solving.
Mathematics Assessment Project
Middle School Mathematics Test 5
A middle school test contains two 40-minute sections covering material through algebra. All questions involve applied problem solving or mathematical analysis.
Mathematics Assessment Project
Middle School Mathematics Test 2
A 13-page test with two 40-minute sections covers multiple years of math content. It incorporates applied problems and mathematical analysis.
101 Questions
Joulies
Does your coffee get too cold too fast? Joulies just might be your answer! Learners use experimental data to make a conclusion about how effective Joulies are at keeping coffee at the ideal temperature. A video shows the graph of the...
Mathematics Assessment Project
Middle School Mathematics Test 1
A 13-page test contains two 40-minute sections, which provide word problems and applied analysis to cover material from pre-algebra through geometry.
CK-12 Foundation
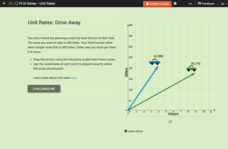
Comparison of Unit Rates: Drive Away
Five questions make up an interactive that challenges mathematicians to compare unit rates. Word problems question scholars about two friends going on a road trip. Scholars manipulate two cars on a coordinate plane to help solve word...
EngageNY
Mid-Module Assessment Task: Grade 7 Mathematics Module 4
Assess the ability of the class to solve percent problems with an assessment that covers a variety of percent problems from basic to multi-step. Pupils make connections between percent problems and proportional thinking to complete the...
EduGAINs
Ratio and Proportion
Do these items have the same ratio? Through a learning contract, pupils master proportions by practicing proportions via word problems, graphs, and with manipulatives. An exit ticket checks for understanding at the end of the...
Curated OER
Problem Solving 1
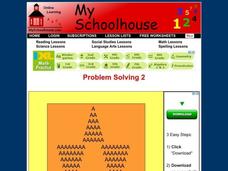
In this online interactive problem solving activity, students examine a diagram and use their problem solving skills in order to respond to 5 questions.
Curated OER
Grasping Graphs
In this grasping graphs worksheet, students solve and complete 3 different types of problems. First, they graph the data described and select the appropriate graph type. Then, students identify the independent and dependent variable. In...
Curated OER
Seized Before Flights: Graph
In this bar graph worksheet, students analyze a graph that show the number of prohibited items intercepted at U.S. airport screening checkpoints. Students answer 3 problem solving questions about the data on the graph.
Curated OER
T-Shirt Lettering
Students determine the cost of a t-shirt using a variety of mathematical operations to solve problems. Then they use a spreadsheet to calculate the cost of lettering a t-shirt and display this information in a graph.
Raytheon
Equations and Graphing Review
In this equations and graphing review instructional activity, learners write, graph and solve equations for 62 problems, including a mid-unit review, with answers included.
Curated OER
Patterns and Functions
Students investigate properties of perimeter and area. In this middle school mathematics lesson, students explore patterns in a problem solving context. Students model and solve problems using various representations for the data as...
Curated OER
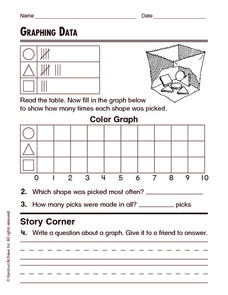
Graphing Data
In this graphing data worksheet, students solve and complete 8 different word problems related to graphing data given. First, they determine the percent of people who do not believe in any of the phenomena described and explain. Then,...
Curated OER
Play It
There are a number of activities here that look at representing data in different ways. One activity, has young data analysts conduct a class survey regarding a new radio station, summarize a data set, and use central tendencies to...
Curated OER
Graphing and Interpreting Linear Equations in Two Variables
Graph linear equations using a table of values. Learners solve equations in two variables using standard form of an equation. They identify the relationship between x and y values.
Curated OER
Long Distance Phone Plans
In this long distance phone plane worksheet, students compare various phone plans and determine which long distance plan has the greatest savings. Students support their answers visually through the use of tables and graphs. They write...


