Curated OER
High Mountain Retreat
Students explore and analyze atmospheric conditions for a high mountain retreat. They examine the relationship between altitude, atmospheric pressure, temperature and humidity at a particular location. In addition, they write reports...
Curated OER
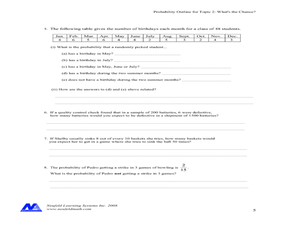
Concept: What's The Chance?
In this concept worksheet, students perform probability experiments. Using collected information, they interpret the data. Students answer questions about probability. This five-page worksheet contains approximately 15 multi-step...
Curated OER
Study of Chance
Seventh graders determine the fairness of various games. In this determining the fairness of various games activity, 7th graders use spinners, dice, and rock,paper, scissors to play various chance games. Students determine if each game...
Curated OER
How Much Is Too Much?
Students examine population growth and collect data. In this statistics lesson, students create a scatter plot to represent the different species found in the water and are being harvested. They graph their data and draw conclusion from it.
Curated OER
Impact!!
Pupils perform a science experiment. In this algebra lesson, students collect data from their experiment and create a graph. They analyze the graph and draw conclusion.
Curated OER
Probability Lesson Plan
Your learners will examine probability through experiments and dice games. Using a computer, your class will perform simple experiments to collect and analyze data to determine the probability of different experimental results. Students...
Curated OER
Probability
Students explore the concept of probability. In this probability lesson, students draw golf balls of different colors out of a bag and determine the probability of drawing a particular colored ball. Students make a number wheel with a...
Curated OER
Fractions, Decimals, and Percents
Students connect different mathematical concepts. They create a circle graph. Students then create a question in which they collect data in order to convert fractions to decimals and decimals to percents.
Curated OER
Create and Analyze Rectangular Patterns
Students explore the concept of geometric patterns. In this geometric pattern lesson plan, students use Microsoft Excel to explore geometric patterns. Students analyze growth rates of pattern growth. Students create their own...
Curated OER
Representing Rational Numbers
Seventh graders explore rational numbers. In this fractions, decimals, and percents lesson, 7th graders identify and compare equivalencies between fractions, decimals, and percents. Students use hands-on activities to investigate the...
Curated OER
Traffic Light Probability
Students discuss the possible traffic signals that may be observed on the way to a field trip. They record data on the trip, and analyze the probability of the results occurring again.
Curated OER
Figuring Elapsed Time
Students discover the concept of elapsed time. For this calculating time lesson, students utilize the Internet to complete record sheets based on the concept of elapsed time. Finally, the students answer questions on their own.
Curated OER
Mathematical Magazines
Students look through magazines and calculate the percentages of the types of ads in the magazines. For this percentages lesson plan, students create a graph to show their results.
Curated OER
Finding Mean, Mode and Median in the Computer Lab
Students create spreadsheets which will display and figure mean, median, and mode of a set of numbers.
Curated OER
Help! I Need Five Minutes
Young scholars practice ways to better manage their time. They keep track of their current use of time. Students prioritize and schedule events and use a daily planning calendar to schedule their time.
Curated OER
Creating Line Graphs
Learners relate data to coordinate graphs and plot points on this graph. They use minimum wage data to construct the graph. Students decide appropriate time intervals for the graphs. They share graphs with their classmates.
Curated OER
Global Statistics
Students select appropriate data to determine the mean, median, mode and range of a set of data. They calculate the statistical data on literacy rates and life expectancy within each geographic region of the world. Students determine...
Curated OER
Living Room Redecoration
The student calculate area and perimeter based on the dimensions of a living room. They determine the amount of supplies needed for painting and carpeting the room. Students create a portfolio of their information.
Curated OER
Aruba Cloud Cover Measured by Satellite
Students analyze cloud cover and to compose written conclusions to a given related scenario. They submit a letter of response and a report detailing their calculations and conclusions.
Curated OER
An Introduction to Elementary Statistics
Students explain and appreciate the use of statistics in everyday life. They define basic terms used in statistics and compute simple measures of central tendency.
Curated OER
Advanced Sentence Completion: 11
For this sentence completion worksheet, students fill in the blank for the correct words for each sentence. Students complete 10 multiple choice questions. Click on "show all" to see the rest of the worksheet.
Curated OER
Pumped Up Gas Prices
Students spend one month keeping track of the mileage and gasoline amounts they or their family has used. Information is entered into a spreadsheet to help calculate the average gas prices over time.
Curated OER
Using Computer for Statistical Analysis
Students examine the use for spreadsheets in analyzing data. They make spreadsheets that display and calculate a given data set such as temperature change.
Curated OER
Pay Check Advance Loans
Students explore the implications of obtaining loans. They assess interest rates, amount to be paid back, and the implications if they do not pay back the loan on time. Students develop a comparison chart.


