Curated OER
Breakfast Cereal - How Nutritious Is Yours?
Young scholars analyze the nutritional value of breakfast cereal in order to make an informed choice. They create a stem and leaf plot which analyzes the nutritional value of the cereal they eat on a regular basis. Students write a...
Curated OER
Investigation - Looking For Triangles
Seventh graders investigate a series of triangles, looking for patterns and generalizing what they have found. They analyze the pattern data and organize it into a table and graph. Students identify the relationship and discover the rule...
Curated OER
Investigating Median, Mode, and Mean
Learners develop strategies to organize data while following teacher demonstration. They calculate the mean, median and mode of a data set while determining the relationships between the numbers. They analyze data from tables and double...
Curated OER
Using Basic Properties to Solve Problems in Math
Learners identify and define the rules of properties of real numbers. They rewrite each of the problems listed using the commutative or associative properties. Pupils apply problem solving strategies to clarify situations in a table...
Curated OER
Entrance Ticket
Students collect data on different events and word problems. In this algebra lesson, students use a table to organize their data. They graph their coordinate pairs on a coordinate plane and make predictions.
Curated OER
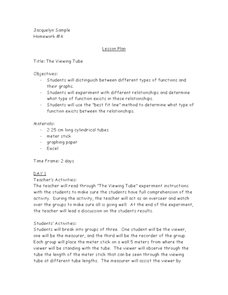
The Viewing Tube
Looking for an excellent lesson plan that incorporates math, science, and technology? Groups of three students use a viewing tube to perform an experiment, and discover how to organize their data into an Excel spreadsheet. This is a...
Illustrative Mathematics
Heads or Tails
Heads! A great way to practice probability is to flip a coin in class. The provided data allows your mathematicians to predict the probability of heads in ten coin flips. Bring coins to class and allow your own trial of heads or tails....
Curated OER
Circles Minilab
Students learn how to measure the diameter and circumference of a circle. In this circle lesson, students organize their data to create a graph. Students utilize their graph to make an inference about the slope of pi.
Curated OER
Weather In The World
Students investigate the weather in different places in the world. In this algebra lesson, students use technology to gain an understanding of how to study integers. They add and subtract integers on a number line.
Curated OER
Collect, organize and compare different data for the Marine Mammals of the Miami Seaquarium, i.e.: size, weight, diet and habitat and how to calculate average, median, mode and range.
Learners collect, organize, and compare different data and develop statistical methods such as: average, median, mode and range as a way for decision making by constructing table
Curated OER
The Bigger they Are . . .
Young scholars do a variety of data analyses of real-life basketball statistics from the NBA. They chart and graph rebounding, scoring, shot blocking and steals data which are gathered from the newspaper sports section.
Illustrative Mathematics
Electoral College
A cross-curricular resource that takes the electoral votes and allows your learners to organize and analyze the data. Young voters can determine which states are more influential and interpret the dotplot provided for more data....
Curated OER
Old Glory
Students utilize mathematical concepts such as: measurement, ratio and proportion and geometric probability to analyze the components of the U.S. Flag. They collect, organize and interpret data by constructing charts, tables and graphs...
Curated OER
Investigation-How Many Toothpicks?
Seventh graders use toothpicks to investigate a series of designs and identify patterns. Data is organized and analyzed using tables and graphs, and students make generalizations using algebraic expressions.
Curated OER
Graphs Review
Seventh graders review different types of graphs such as bar graphs, line graphs, box & whisker plots. As a class, they read a story and construct graphs to solve the data in the story. Students play "Graph Jeopardy" which requires...
Curated OER
Discovering the Magical Pi
Students calculate pi using data on the circumference and diameter of various objects. They define key vocabulary terms, measure the circumference and diameter of various circular objects, organize the data on a table or chart, and...
Curated OER
Graph and Compare the Adventure's Temperature Vs. Local Temperature
Pupils explore the concept graphing data. In this graphing data lesson, students use weather data from their local weather and some other city and graph them. Pupils plot the local weather vs. another city. Students record temperature...
Curated OER
Count The Letters
Students perform activities involving ratios, proportions and percents. Given a newspaper article, groups of students count the number of letters in a given area. They use calculators and data collected to construct a pie chart and bar...
Curated OER
Range, Mean, Median and Mode Through the Internet
Middle schoolers compute measures of central tendency. In this range, mean, median and mode lesson, students gather information on the internet, organize the data and then compute the measures of central tendency. They create a...
Curated OER
Finding the Percent of a Number in Fish Body Weight
Students use fractions to find the weight of fish. They use percentages to determine the correct amount to feed them. They organize their data into a graph and shares with the class.
Curated OER
Geometric Relatioships
Students explore measurements and geometric formulas. In this geometry lesson, students investigate pi as it relates to geometry. They collect data and use a chart to organize the data.
Curated OER
Paper Parachutes
Pupils participate in a simulation of a parachute-jump competition by making paper parachutes and then dropping them towards a target on the floor. They measure the distance from the point where the paper parachute lands compared to the...
Curated OER
Firewood Problem
Middle schoolers write and solve their own story problems. They determine the cost of firewood by the cord. They organize their data in graphs and charts.
Curated OER
Box-and-Whisker
Seventh graders are introduced to the concept of box-and-whisker plots. A step-by-step process for creating a box-and-whisker plot is provided. The goal of the lesson is that students study the components of a box-and-whisker plot and be...


