Curated OER
How Much Is Too Much?
Young scholars examine population growth and collect data. In this statistics lesson, students create a scatter plot to represent the different species found in the water and are being harvested. They graph their data and draw conclusion...
Curated OER
Comparing Fractions
Students discuss the nature of fractions and compare fractions based on a similar whole to determine relative size.
Curated OER
Virtual Field Trip: Lodging and Meals
Students calculate the costs for lodging and meals for a virtual field trip. They calculate the number of nights lodging needed for road and city travel and the number of meals needed, the costs for each, and input the data using...
Curated OER
The Million $ Mission
Students study exponential growth. The lesson is designed for students to work independently, or in groups with guidance from the teacher.
Curated OER
Conversions: Metrics Made Easy
Students convert standard units of measurement to metric units using tape measures, meter sticks, rulers, and online conversion calculators.
Curated OER
Scientific Notation I: The Exponent
Students manipulate and interpret large numbers expressed in the "exponent" format of scientific notation.
Curated OER
FREE STANDING STRUCTURE
Students demonstrate basic construction skills by building a free standing structure. They compute the cost of the structure.
Curated OER
Fraction Facts
Students are introduced to fractions, including operations with fractionsm converting fractions to decimals and percents. They are provided with activities that provide ample practice opportunities to reinforce the information from the...
Curated OER
What are the Odds
Students predict the-outcome of an event. In this algebra lesson plan, students compare and contrast the probability of an event occurring. They calculate the odds of a simple event and make estimation.
Curated OER
Solving Algebraic Expressions
Students simplify equations and expressions. In this algebra lesson, students add, subtract, multiply and divide as they solve expressions. They relate factoring to solving polynomials.
Curated OER
Company is Coming
Learners find a recipe for pancakes on the web then figure out how to half the recipe then figure how to make 3/4 of the pancakes.
Curated OER
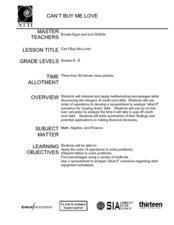
Cannot Buy Me Love
Students investigate the concepts that are related to finance and how it is used in the world. They take part in activities that are focused around the use of a spreadsheet while using a T-chart to simulate a ledger of credits and debits.
Curated OER
Buying My First Car
Students pretend they are about to buy their first new car. They must do all the calculations necessary to estimate the cost of purchasing the car. They see that the math they learn in school really does have real-life applications.
Curated OER
Pardon me. Do You Have exChange for a Dollar?
Students are familiar with United States currency-dollar and cents. They are asked to compare it with currency of another country. Students explore currencies of various countries using the Internet, video, and hands-on activities. ...
Curated OER
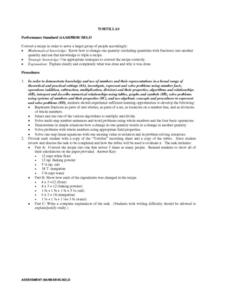
Tortillas
Middle schoolers convert recipes for tortillas. They calculate the amounts of ingredients as they convert recipes and write an explanation of the task to demonstrate their calculations. After reviewing their calculations, they...
Curated OER
What's the Cost?
Students consider what things cost 150 years ago and what those costs would be in today's money. They compare costs and services between the 1850s and today to find out if things are cheaper or more expensive today, in inflation-adjusted...
Curated OER
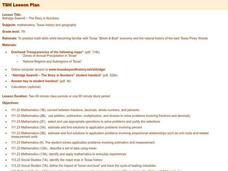
Aldridge Sawmill - The Story in Numbers
Seventh graders practice math skills while becoming familiar with Texas' "Boom & Bust" economy and the natural history of the east Texas Piney Woods. They utilize worksheets and websites imbedded in this plan.
Curated OER
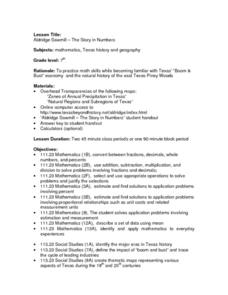
Aldridge Sawmill - The Story in Numbers
Seventh graders view overhead maps of Texas, explore history of Aldrige Sawmill, and practice math skills while becoming familiar with Texas' "Boom & Bust" economy and natural history of east Texas Piney Woods.
Curated OER
Aldridge Sawmill -- The Story in Numbers
Seventh graders view a recent transparency of the average rainfall zones of the state of Texas. Using another transparency, they identify the Piney Woods subregion of the Gulf Coastal Plain and locate national forests and sawmills. ...
Curated OER
Divided We Stand
Students figure out how to arrange seating in a concert hall given specific requirements. They better explain how dividing can allow us to arrive at mathematical solutions quickly and logically.
Curated OER
Walking Home
Middle schoolers discover the formulas for calculating distance. In groups, they solve equations determine the distance in a specific amount of time. They record their answers in a chart or graph and compare them with their classmates.
Curated OER
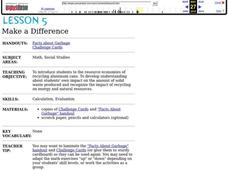
Make a Difference
Middle schoolers are introduced to the resource economies of recycling aluminum cans. They develop understanding about their own impact on the amount of solid waste produced and recognize the impact of recycling on energy and natural...
Curated OER
Math & Social Science
Learners are given data and are to calculate averages and yearly totals of how many cars travel the Tacoma Narrows Bridge. They also make a graph of the data.
Curated OER
"The Rajah's Rice: A Mathematical Folktale from India" adapted by David Barry
Students use large numbers and learn exponential representation and explain patterns and relations of powers of 2.
Other popular searches
- 100 Multiplication Problems
- Free Multiplication Problems
- Multiplication Problems 4
- Multiplication Problems X 6
- X4 Multiplication Problems
- Word Problems Multiplication
- Math Multiplication Problems
- Story Problems Multiplication
- Words Problems Multiplication


