S2tem Centers SC
Investigating Chance Processes of Probability
How likely is it that the school cafeteria will serve chicken tomorrow? Discover the concept of probability with the roll of the dice. Pupils evaluate the liklihood of several statments about everyday life. Then, a mathematical...
Kentucky Adult Education
Probability Lesson Plan
Roll the dice with this multimedia math lesson on probability. After first viewing a series of three short videos explaining probability, independent events, and dependent events, young mathematicians complete a set of practice...
EngageNY
Estimating Probabilities by Collecting Data
Take a spin to determine experimental probability. Small groups spin a spinner and keep track of the sums of the spins and calculate the resulting probabilities. Pupils use simulated frequencies to practice finding other probabilities to...
Curated OER
Conditional Probability and Probability of Simultaneous Events
Your statisticians examine the characteristics of conditional probability and the probability of simultaneous independent events. They perform computer activities to find probabilities for simple compound events. They examine the...
American Institutes for Research
Data and Probability: Marshmallow Madness
Upper grade and middle schoolers make predictions, collect data, and interpret the data as it relates to the concept of probability. They work with a partner tossing marshmallows and recording if they land on their side or on their...
Curated OER
Data Analysis, Probability, and Discrete Math
Choose to supplement your probability unit with this resource and you won't be disappointed with the outcome. Teach young mathematicians to organize information using tree diagrams and lists in order to determine the possible outcomes of...
Curated OER
Money Vocabulary
Explore the monetary system by completing worksheets in class. Learners will identify the monetary units of England and collaborate in groups to solve money word problems. They also identify several money-related vocabulary terms before...
Virginia Department of Education
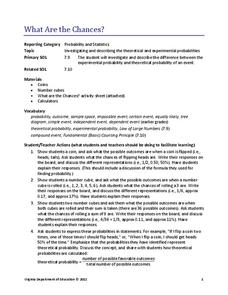
What Are the Chances?
Take a chance on an informative resource. Scholars conduct probability experiments involving coins and number cubes to generate data. Compiling class data helps connect experimental probability to theoretical probability.
Curated OER
Probabilities for Number Cubes
Students explore the concept of probability. In this probability lesson, students roll a six-sided number cube and record the frequency of each outcome. Students graph their data using a frequency chart and keep tally marks in a...
Alabama Learning Exchange
Bear Factory Probability
By examining a set of dice roll data, statisticians determine the probability of different sums occurring. They visit an interactive website and determine how many different vacation outfits Bobbie Bear will have based on the colored...
Alabama Learning Exchange
Probability with Tree Diagrams
Middle school math whizzes view a PowerPoint tutorial on tree diagrams. Using "Anthonio's Pizza Palace," an interactive activity involving the selection of pizza toppings, they use Pascal's triangle as a tree diagram. This is an engaging...
Oklahoma State University
Hairy Heredity
Young scholars learn that heredity comes down to the flip of a coin with this cross-curricular math and science lesson. Using smiley faces as a model, students toss coins to determine which dominant or recessive traits will be passed on...
Curated OER
Intro To Probability
Students investigate the concepts related to the practice of using probability. They review the use of mean, median, and mode within the context of previous instruction. Students predict outcomes and calculate them in small groups. The...
Curated OER
Investigation - How Tall is the Average Sixth Grader?
Students will measure each other and record the data in inches. They will use a stem and leaf plot to display data and figure out the average height of the students in a class. The other statistical data will be collected like the mode...
Virginia Department of Education
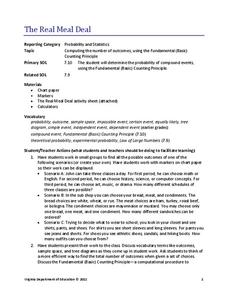
The Real Meal Deal
Burgers and salads and sodas, oh my! Scholars use a menu to investigate the Fundamental Counting Principle. They create tree diagrams to illustrate the number of possible choices for each given scenario.
Curated OER
A Slice of Pi
Math pupils, by viewing a video, discover the history of pi and some of the applications of its uses in the world today. They conduct an experiment by measuring the diameter and circumference of various circular objects to calculate...
Curated OER
What Are The Chances
Students calculate the probability of an event occurring. In this probability instructional activity, students differentiate between independent, dependent or compound events. They find the range of the data.
Curated OER
Investigation-Pattern/Functions
Students explore number patterns. In this number patterns and probability math activity, students work in groups to describe the patterns present in the first five rows of Pascal's Triangle, then write numbers to continue this pattern....
Curated OER
Graphs: All About Our Class
Students respond to survey questions, discuss results, brainstorm ways to represent survey information, and create table of class results. They find mean, range, and percentages, and create graph to display results.
Curated OER
Solving Genetic Puzzles
Seventh graders examine genetics combination using statistics. In this statistics lesson, 7th graders examine genetic trait using a table or punnett square to identify genotype and phenotype. This assignment requires more than one class...
Curated OER
Which Bag is Which?
Learners explore number sense by completing a statistical analysis game in class. In this data graphing instructional activity, students utilize visual references such as colored cubes and tiles to map out the results of an experiment...
Curated OER
Mean, Median, and Mode
Seventh graders examine the uses of mean, median, and mode. They define key vocabulary terms, observe the teacher model examples of mean, median, and mode, and discuss real world examples of central tendency of sets of data. Students...
Pennsylvania Department of Education
Equal Groups
Students explore statistics by completing a graphing activity. In this data analysis lesson, students define a list of mathematical vocabulary terms before unpacking a box of raisins. Students utilize the raisins to plot data on a line...
Curated OER
Is the Hudson River Too Salty to Drink?
Learners explore reasons for varied salinity in bodies of water. In this geographical inquiry lesson, students use a variety of visual and written information including maps, data tables, and graphs, to form a hypothesis as to why the...


