Curated OER
Graphs and Functions
Middle schoolers describe plotting functions on the Cartesian coordinate plane. They solve functions on paper and using an online tool to plot points on a Cartesian coordinate plane creating lines and parabolas.
Curated OER
Introduction to Graphs: Bar Graphs, Line Graphs, Circle Graphs
In this graphing data worksheet, students answer 5 short answer questions about graphs. Students determine which type of graph best represents various data sets.
Curated OER
Creating Line Graphs
Learners relate data to coordinate graphs and plot points on this graph. They use minimum wage data to construct the graph. Students decide appropriate time intervals for the graphs. They share graphs with their classmates.
Curated OER
Functions and Graphing
Graphing functions in a real world application makes math come to life. Learners graph points on a coordinate plane and identify various points on a graph by working through a set of real world problems. This is a perfect review exercise.
Curated OER
Graphing Lines That Don't "Fit"
How can you graph lines that don't seem to fit on the given graph? What makes a line straight? What does the rate of change mean when graphing a line? How do you know if a slope is positive or negative? How do you know if the graph of a...
Curated OER
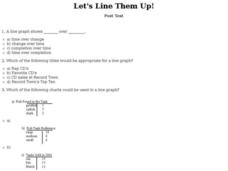
Let's Line Them Up! Post Test
In this line graphs worksheet, students answer multiple choice questions about line graphs. Students complete 10 multiple choice questions.
Curated OER
Graphing in the Information Age
Students create a variety of graphs based on population data. In this statistics lesson, students use data that can be gathered on-line to make a bar chart, line graph, and circle graph.
Curated OER
Graph Made Easy: Post Test
For this graphs worksheet, students answer multiple choice questions about line graphs and bar graphs. Students answer 10 questions total.
Curated OER
Savings Planning Using Tables, Line Graphs and Early Proportionality
Students use proportional reasoning to make a chart of daily savings transactions and balances. In this accounting lesson, students read word problems and complete three handouts about a bidding and accounting problem. Students finish...
Curated OER
What's in a Graph?
Students explore how to use and interpret graphs. The graphs are pulled from a variety of sources, and the activities ask students to interpret graphs. They start this lesson with knowledge of what a graph is. Students also know how to...
CK-12 Foundation
Input-Output Tables for Function Rules
How does changing a graph affect the function? Learners watch the changing input-output table as they adjust the location of the line graph. Questions prompt them to complete a table of values and determine the function rule.
Curated OER
Frequency, Histograms, Bar Graphs and Tables
In this frequency worksheet, students interpret histograms, bar graphs and tables. They examine frequency charts and comparison line graphs. This three-page worksheet contains 4 problems. Answers are provided on the last page.
Curated OER
Contour and Cross-Section Skills
For this geography worksheet, learners identify the Wolf Creek Crater and how it was formed. They examine a contour map given of how the crater would look from above. Then, pupils use a ruler to draw lines as on the graph to the side....
Curated OER
Quiz: Reading and Making Line Plots
In this reading and making line plots instructional activity, students create a line plot for given sets of numbers. In addition, they read graphs and interpret the average. This one-page instructional activity contains ten problems.
Curated OER
Introduction to Representing and Analyzing Data
Represent data graphically. Allow your class to explore different methods of representing data. They create foldables, sing songs, and play a dice game to reinforce the measures of central tendency.
Curated OER
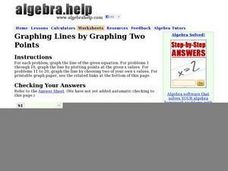
Graphing Lines by Graphing Two Points
Use a graphing lines worksheet to have your mathematicians graph the line of a given equation and plot specified points. The first 10 problems have a given equation, and two values. The next 10 problems have a given equation, but your...
Illustrative Mathematics
Puzzle Times
Give your mathematicians this set of data and have them create a dot plot, then find mean and median. They are asked to question the values of the mean and median and decide why they are not equal. Have learners write their answers or...
Curated OER
Line Graphs
Seventh graders create a line graph and identify when to use line graphs. In this line graphs lesson, 7th graders analyze the average temperatures of various cities. Students graph the data they collected.
Curated OER
Fire!, Probability, and Chaos
Upper elementary and middle schoolers work with the concept of probability. They are introduced to the concept of chaos. Learners graph and analyze using a line plot, work with mean, and are introduced to the concept of variance.
Noyce Foundation
Granny’s Balloon Trip
Take flight with a fun activity focused on graphing data on a coordinate plane. As learners study the data for Granny's hot-air balloon trip, including the time of day and the distance of the balloon from the ground, they practice...
Curated OER
The Barbie Bungee Drop
What do math, bungee jumping, and Barbie® have in common? Young adventure seekers use rubber bands as bungee cords to predict a thrilling, but safe, jump for their doll. First, test jumps are conducted with a few rubber bands. Then more...
Curated OER
Interactivate - Lines, Rays, Line Segments, and Planes
Students explore lines, rays, line segments, and planes. In this math lesson, students discuss the math concepts and direct their instructor in graphing functions. Students collaborate in graphing additional functions.
Utah Education Network (UEN)
Linear Relationships: Tables, Equations, and Graphs
Pupils explore the concept of linear relationships. They discuss real-world examples of independent and dependent relationships. In addition, they use tables, graphs, and equations to represent linear relationships. They also use ordered...
Curated OER
Slope-Intercept Form of a Line
Using the subscriber website Explorelearning.com, young mathematicians observe changes in the slope and y-intercept and their effect on the graph of lines. This activity helps students develop an intuitive sense of the connection between...
Other popular searches
- Double Line Graphs
- Graphs. Line Graphs
- Bar and Line Graphs
- Interpreting Line Graphs
- Making Line Graphs
- Reading Line Graphs
- Analyzing Line Graphs
- Creating Line Graphs
- Number Line Graphs
- Reading Double Line Graphs
- Straight Line Graphs
- Bar Graphs Line Graphs


