Curated OER
Ice Cream
Students explore the concepts of mean, median, mode, and range as they elicit data about people's favorite flavor of ice cream. A practical application of the data obtained offers an extension to the lesson plan.
Scholastic
Study Jams! Tree Diagrams
With so many toppings to chose from, make the ice cream truck combinations a fun math problem that teaches your learners about outcomes. The video introduces a tree diagram that allows your mathematicians to see how to create...
Curated OER
Ice Creams
Students list all the outcomes for single events, and for two successive events in a systematic way. When dealing with a combination of two experiments, they identify all the outcomes, using diagrammatic, tabular or other forms of...
Curated OER
How Many?
Students investigate concepts related to data collection and interpretation. They generate all possible outcomes in a beginning study in the realm of statistics. The use of real life situations helps to engage students.
Curated OER
Food Probability
In this math worksheet, students plot the possibilities of outcomes for making sandwiches and ice cream in the graphic organizers.
Curated OER
Concept Attainment Model: Volume and Surface Area
Using a concept attainment approach, learners identify surface area and volume by sorting examples (photos) that depict each concept (positive) from those that don't (negative). Then as a class, they develop definitions of each term...
Raytheon
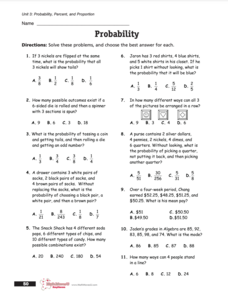
Probability, Percent, and Proportion
In this probability and predictions learning exercise, students read 1 page of facts, then solve 8 pages of problems related to probability, with answers keys included.


