Curated OER
Completing frequency diagrams from displayed data
In this frequency activity, learners use data in graphs and charts to complete a frequency diagram. Students fill in 26 spaces in the diagram.
Alabama Learning Exchange
Probability with Tree Diagrams
Middle school math whizzes view a PowerPoint tutorial on tree diagrams. Using "Anthonio's Pizza Palace," an interactive activity involving the selection of pizza toppings, they use Pascal's triangle as a tree diagram. This is an engaging...
Curated OER
Data Management and Probability: Applications
In this data management and probability applications worksheet, 7th graders solve 13 different types of problems that include finding the mean, median, mode, and range of each set of values, as well as, solving a number of word problems....
West Contra Costa Unified School District
Introduction to Conditional Probability
Here is a turnkey lesson that walks young statisticians through the development and uses of conditional probability. From dice games to surveys, Venn diagrams to frequency tables, the class learns how a given can effect the overall...
CK-12 Foundation
Basic Counting Rules: Sandwich Shop
Young mathematicians make a tree diagram of all possibilities for sandwiches using an interactive. They learn how multiplication speeds up the process of finding the number of outcomes.
Curated OER
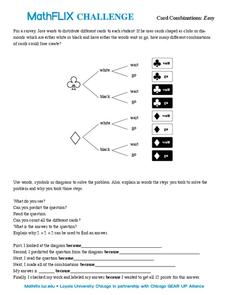
Card Combinations
In this card combinations worksheet, learners solve and complete 8 different problems that include determining the number of card combinations found. First, they use words, symbols or diagrams to solve the problem and explain the steps...
Virginia Department of Education
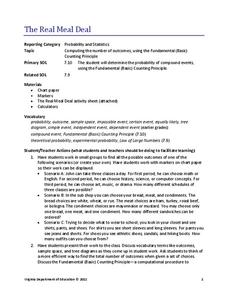
The Real Meal Deal
Burgers and salads and sodas, oh my! Scholars use a menu to investigate the Fundamental Counting Principle. They create tree diagrams to illustrate the number of possible choices for each given scenario.
Jordan-Granite Consortium
Scatter Diagram
You aced the first test, so your score on the second one shouldn't matter, right? Young pupils first draw a best fit line on a provided scatter plot showing test scores for two different tests. They then evaluate five statements on the...
Actis
Handling Data: Probability, Tree Diagrams
Clean, but captivating, two online simulations demonstrate probability for middle schoolers. They can choose the number of coins and tosses and watch as the results pile up. They can choose from a variety of spinner types and the number...
CK-12 Foundation
Sets: Bikes or Boards?
Do people ride, slide, or do both? Pupils use an interactive Venn diagram for the numbers of people owning bicycles, owning skateboards, or both. An interactive provides questions for them to answer using the diagram.
Teach Engineering
Energy Forms and States Demonstrations
Does a tennis ball have energy? What about a bowling ball? Demonstrate concepts of different forms of energy forms and states with a variety of objects. Using the equations for potential and kinetic energy, learners determine the amount...
EngageNY
Population Problems
Find the percent of the population that meets the criteria. The 17th segment of a 20-part unit presents problems that involve percents of a population. Pupils use tape diagrams to create equations to find the percents of subgroups of the...
Curated OER
Everybody Needs a Rock
Students, after making quantitative and qualitative observations of their rocks, construct a Venn diagram or dichotomous key to classify their rocks.
Shodor Education Foundation
Tree Diagrams and Probability
Aspiring statisticians create tree diagrams and figure probabilities of events based on those diagrams. They practice adding and multiplying fractions and explain complementary probabilities. Students use computers activities to make...
Curated OER
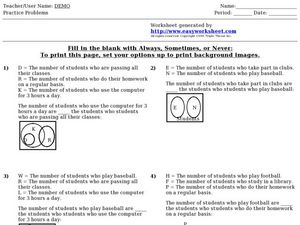
Sets: Always, Sometimes, or Never
In this sets worksheet, students solve 4 fill in the blank problems. Students determine if the given statement about a diagram is always, sometimes, or never true. Students use diagrams to determine which set of people overlap.
Scholastic
Study Jams! Combinations
With so many combinations, this colorful video allows your learners to mathematically figure out how many options they have when purchasing t-shirts. One instructional activity teaches how to find out the combinations, and the second...
Curated OER
Understanding Oceans
Students investigate how ocean currents affect our world. In this ocean currents lesson, students perform an experiment to show how cold water is near the poles and warm water is near the equator. Students use water, food coloring, ice...
Noyce Foundation
Double Down
Double the dog ears, double the fun. Five problems provide increasing challenges with non-linear growth. Topics include dog ears, family trees and population data, and geometric patterns.
Math12
Basics of Probability
Give your middle schoolers a fighting chance at understanding probability. Offering numerous examples that clearly demonstrate basic probability concepts, this resource helps young mathematicians learn how to visualize the...
Curated OER
Probabilities for Number Cubes
Middle schoolers explore the concept of probability. In this probability lesson, students roll a six-sided number cube and record the frequency of each outcome. Middle schoolers graph their data using a frequency chart and keep tally...
New York Science Teacher
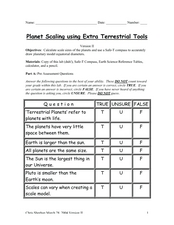
Planet Scaling using Extra Terrestrial Tools
Your class will use a set scale to convert diameters of planets to the model size, the diagram given to expand on the number of planets drawn as concentric circles, and examine the scale that would be needed to fit the larger planets on...
Northwest High School Science
Metric Conversion: Stair-Step Method
Elevate young scientists' skills with unit conversion using the stair-step method. Detailed instructions and a neat stair-step diagram are on the first page. Four pages of practice problems follow, mostly with real-world applications....
Curated OER
Probability: Grade A
Math whizzes explore dependent and independent outcomes. They determine the outcome of simple and compound events. Pupils complete tree diagrams to identify outcomes. They identify fair and unfair games. This two-page worksheet contains...
Curated OER
Similarity: Instructional
For this similarity worksheet, students solve and complete 7 different problems that include determining various dimensions of mirrors shown. First, they find the length of the diagonal of the large mirror in the diagram. Then, students...
Other popular searches
- Sets and Venn Diagrams
- Venn Diagrams
- Tree Diagrams
- Lewis Dot Diagrams
- Energy Transfer Diagrams
- Algebra 1 Venn Diagrams
- Human Body Anatomy Diagrams
- Math Venn Diagrams
- Electron Dot Diagrams
- Blank Venn Diagrams
- Ray Diagrams
- Carroll Diagrams


