Curated OER
Choosing a Summer Job
What did you do over your summer vacation. Young wage earners must compare summer job options, and determine when each job earn the same amount and what that amount be. This be done by creating, graphing, and solving systems of...
Curated OER
Statistics Newscast in Math Class
Students study sports teams, gather data about the teams, and create a newscast about their data. In this sports analysis lesson, students research two teams and define their statistical data. Students compare the two teams, make...
Curated OER
Education for Global Peace
Students survey the class and graph the results. In this graphing and data collection lesson plan, students conduct a survey to see where their shirts were produced. Individuals use software to graph the results and create a written...
Curated OER
Childhood Obesity
Students identify a question to generate appropriate data and predict results. They distinguish between a total population and a sample and use a variety of methods to collect and record data. Students create classifications and ranges...
Curated OER
Jumping in the Air - What was your Height?
Students solve equations using the quadratic formula. In this quadratic equations lesson, students use digital cameras to film students jumping and import film clips into a computer. Students use the data in the quadratic formula...
Curated OER
Doing The School Run
Young scholars explore finding the percent of a numbers. They survey their peers to determine modes of transportation used in getting to school. Afterward, students organize information and create graphs and charts. They explore...
Curated OER
Checking County Numbers
Students use their county's information page to gather information about their community. Using the information, they create graphs from the tables provided and interpret the data. They write a paragraph showing their interpretation of...
Curated OER
Code Breakers
Young scholars collect data and make a frequency table, change ratios into percents, and analyze data to make predictions.
Curated OER
Pepe Cleaners
Seventh graders gather data to determine the relationships between the base and height of rectangles with fixed perimeters and express the relationships using words and symbols. Students build rectangles with pipe cleaners. They create...
Curated OER
Missed The Boat
Learners complete time and distance problems. Using appropriate problem solving strategies, students determine when a helicopter will catch a cruise ship. Learners write a summary of their solution process. They complete a graph to...
Curated OER
Random Number Generators And Probability, Will the Wings Win??
Students participate in probability experiments and simulations while modeling and solving problems. They examine how to use the random number generator on a graphing calculator using examples from their local hockey teams.
Curated OER
Budgeting 101
Students identify various sources of income and discern between needs and wants as they also learn to create a personal budget. In this personal budget lesson, student understand financial scenarios as they relate to different ways...
EngageNY
Markup and Markdown Problems
There is a 100 percent chance this resource will help pupils connect percents to financial literacy. Young mathematicians use their knowledge of percents to find markups and markdowns in financial situations in the seventh segment in a...
Curated OER
Flip a Coin
Students are introduced to the concept of probability. In groups, they make a prediction about how many times a coin might show heads or tails when flipped. They carry out the experiment and record their results to compare it to their...
Curated OER
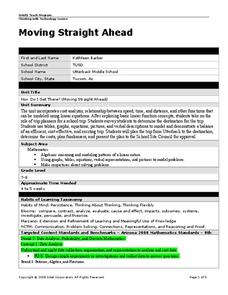
Moving Straight Ahead
Students analyze the relationship between speed, time and distance. In this math lesson plan, students plan a school trip. Students determine the efficiency and cost effectiveness of a trip.
Curated OER
United States Population: Using Quadratic Models
In this United States population worksheet, students solve word problems about the United States population by using the quadratic formula. Students complete 6 problems.
Curated OER
Pizza Topping Combinations
Students brainstorm pizza toppings and determine the number of possible ways to order a pizza. In this algebra instructional activity, students analyze and investigate geometric patterns as they relate to the concept of a variable....


