Mathematics Assessment Project
Mean, Median, Mode, and Range
What a find! Here is a lesson, designed to meet sixth grade math Common Core standards, that focuses on the calculation of different measures of center for the scores from a penalty shoot-out competition. An independent...
Curated OER
Investigating Median, Mode, and Mean
Students develop strategies to organize data while following teacher demonstration. They calculate the mean, median and mode of a data set while determining the relationships between the numbers. They analyze data from tables and double...
California Education Partners
Least and Greatest
Squares can be magic. Pupils use their knowledge of addition of positive and negative rational numbers to create a 3 X 3 magic square where the sums are 1. Scholars create addition and multiplication expressions with a set of rational...
Curated OER
VARIABLES AND PATTERNS, USE AFTER INVESTIGATION THREE. DISCRETE OR CONTINUOUS LINEAR RELATIONS.
Students discover for which kind of linear function is appropriate to use the "scatter" or the "connected" term. In this lesson, students investigate functions using variables, patterns book, graph paper, rulers and the graphit program.
Curated OER
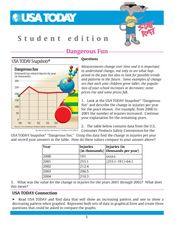
Dangerous Fun
For this line graph worksheet, students analyze the data on a graph about toy-related injuries by year. Students solve 5 problems in which the change in injuries per year is calculated and recorded on a table.
National Research Center for Career and Technical Education
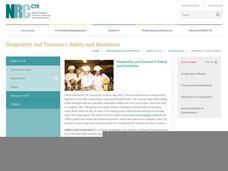
Hospitality and Tourism 1: Safety and Sanitation
Math and science come alive in this career-related lesson on sanitation. Along the way, learners explore bacterial growth rates using exponential notation and graphs. A link to a very brief, but vivid video shows just how quickly these...
Curated OER
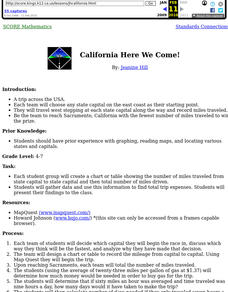
California Here We Come!
A highly relevant and great cross-curricular project! In teams, your class will plot a course from the East Coast to Sacramento, California passing through all of the state capital cities along the way. As part of the journey, teams will...
Curated OER
Monster Graph Activity
Seventh graders engage in a lesson which take the fear out of graphing. They create and draw conclusions from data found in a Monster graph.
Curated OER
The Bigger they Are . . .
Students do a variety of data analyses of real-life basketball statistics from the NBA. They chart and graph rebounding, scoring, shot blocking and steals data which are gathered from the newspaper sports section.
Curated OER
Graphing the Daily Revenue of Miami Seaquarium
Seventh graders compile a table of the revenues of the 8 eateries (a combined total), Main Gate admissions, and the Gift Shop.
Curated OER
The Winner Is...
Young scholars create graph from previously collected data using "The Graph Club."
NOAA
Sustaining Our Ocean Resources
Lead young scientists on an investigation of fishery practices with the final installment of this four-part unit. Using a PowerPoint presentation and hands-on simulation, this instructional activity engages children in learning how fish...
Curated OER
Firewood Problem
Middle schoolers write and solve their own story problems. They determine the cost of firewood by the cord. They organize their data in graphs and charts.
Curated OER
How Do You Spend Your Time?
Students keep records and determine how much time they spend on certain activities. They insert the data into a spreadsheet. Students graphically display data in a bar graph and a circle graph.
EngageNY
Tax, Commissions, Fees, and Other Real-World Percent Problems
Pupils work several real-world problems that use percents in the 11th portion of a 20-part series. The problems contain percents involved with taxes, commissions, discounts, tips, fees, and interest. Scholars use the equations formed for...
Curated OER
Probabilities for Number Cubes
Students explore the concept of probability. In this probability lesson, students roll a six-sided number cube and record the frequency of each outcome. Students graph their data using a frequency chart and keep tally marks in a...
Curated OER
Patterns and Functions
Students investigate properties of perimeter and area. In this middle school mathematics lesson, students explore patterns in a problem solving context. Students model and solve problems using various representations for the data as...
Curated OER
Mapping the Ocean Floor
Students construct and interpret a line graph of ocean floor depth and a bar graph comparing the height/depth of several well-known natural and man-made objects and places. In addition, they calculate the depth of two points using sonar...
Curated OER
Do the Elephants Need Sunscreen? A Study of the Weather Patterns in Etosha
Students analyze the weather patterns in Namibia. They create a graph of the yearly temperatures and use the internet to gather information. They discuss how the weather goes in cycles in the area.
Curated OER
Satellite Technology
In this satellite technology worksheet, students read about Low Earth Orbit satellites and the frictional drag from the Earth's atmosphere that causes them to fall back towards the Earth. Students use given data of the years the...
Curated OER
Linking Algebra to Temperature
Students convert between two units as they calculate the temperature. In this algebra instructional activity, students collect data on seasonal climate and create a graph. They make conjectures based on their data collection.
Curated OER
The Coyote Population: Kansas Prairies
Students discover animal lifestyles by researching their ecosystem. In this animal statistics lesson, students research the geography of Kansas and discuss the reasons why wild animals survive in the open Kansas fields. Students complete...
Curated OER
Choose or Lose: The Electoral Process
Pupils examine the local and national election process. In groups, they brainstorm a list of the issues important to them and compare them to an overall list of issues present in the election. They analyze graphs and complete...
Curated OER
Kites: Patang - The Indian Fighter Kite
Young scholars investigate the history of fighter kites and build their own. In this aeronautics lesson, students discover how other countries utilize fighter kites and where they originated. Young scholars create their own fighter...


