Curated OER
A Statistical Look at Jewish History
Students complete their examination over the Jewish Diaspora. Using population figures, they discover the importance of percentages in exploring trends. They use their own ethnic group and determine how it is represented in the United...
Curated OER
Water - Planning for the Future
Students explore and examine the increases and/or decreases for water user groups: irrigation, municipal, manufacturing, steam electric power generation cooling, livestock, and mining. They utilize percentage changes during their...
Curated OER
Grasping Graphs
In this grasping graphs worksheet, students solve and complete 3 different types of problems. First, they graph the data described and select the appropriate graph type. Then, students identify the independent and dependent variable. In...
Curated OER
Handling Data: Comparing Distributions
Students gather information by analyzing graphs, diagrams and pie charts. In this graphs and diagrams lesson, students complete addition and subtraction problems. Students discuss a pie chart. Students use information to crate a stacked...
Illustrative Mathematics
Overlapping Squares
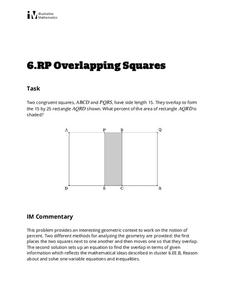
The objective of this activity is to find the percent of the area of a two squares overlapping. Mathematicians find the ratio of area for the part that overlaps to the rectangle formed. The final answer is a percent as a rate per 100....
Curated OER
Adding and Subtracting Integers
Sixth and seventh graders solve 10 different problems that include various integers. First, they determine whether each equation in the first five problems is true or false. Then, pupils solve the last five problems by adding or...
Curated OER
Conversions and Rates
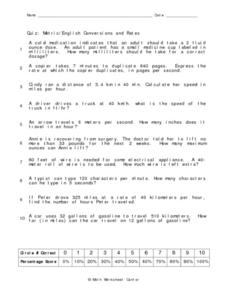
In this conversions and rates worksheet, learners solve 10 different word problems that include using metric conversions and rates to solve each problem. First, they determine the number of milliliters needed for the correct dosage of...
Curated OER
Count The Letters
Students perform activities involving ratios, proportions and percents. Given a newspaper article, groups of students count the number of letters in a given area. They use calculators and data collected to construct a pie chart and bar...
Curated OER
Handling Data: Representing Date - Online Version
Here is an online lesson plan on data representation. In it, learners access websites embedded in the plan which lead them through a variety of activities around data representation and statistics. The activities are quite good, and...
Curated OER
The Statistics of M&Ms
Students explore the topic of statistics with M and Ms. For this math lesson plan, students use candy pieces to sort and gather information needed to create a bar graph. This lesson can be adapted to accommodate students in grades 1-12.
Curated OER
Pictures of Data: Post Test
In this data worksheet, learners answer multiple choice questions about charts and graphs. Students answer 10 questions total.
Curated OER
Learning to Spend, Learning to Give
Students create a monthly budget. In this finances lesson, students learn the terms budget, income and expenses. Students create a monthly spending plan and keep track of what they make and spend for the next 30 days. When complete,...
Curated OER
ou are the Researcher!
Students conduct a census at school. They collect data, tally it, and create a frequency table. Students display their data in three different types of graphs. They write complete sentences describing the graph.
Curated OER
Mental Methods
In this mental methods worksheet, students determine the correct answer when multiplying fractions, percents and decimals. They use mental math to solve problems.
Curated OER
Signed Numbers Word Problems
In this signed numbers learning exercise, students solve 10 different word problems that include using signed numbers in each problem. First, they determine the status of an account given the information stated in the problem. Then,...
Curated OER
Compliment of an Event
In this compliment of an event worksheet, students solve probability problems. Given certain situations, they find the probability of what is "not." This one-page worksheet contains ten problems.
Curated OER
Probability - Mutually Exclusive Events
In this probability worksheet, students calculate the probability of given situations. They complete compound probability of independent events. This one-page worksheet contains six problems.
Curated OER
Probability - Mutually Exclusive Events
In this probability learning exercise, students read story problems and compute the probability of specified events. This one-page learning exercise contains six mutually exclusive scenarios.
Curated OER
Shopping Spree
Young scholars calculate discounts, sale price, and sale tax. In this consumer math lesson, students visit mock stores which have items for sale. Young scholars calculate the final prices of items.
Curated OER
Representing Rational Numbers
Seventh graders explore rational numbers. In this fractions, decimals, and percents lesson, 7th graders identify and compare equivalencies between fractions, decimals, and percents. Students use hands-on activities to investigate the...
Curated OER
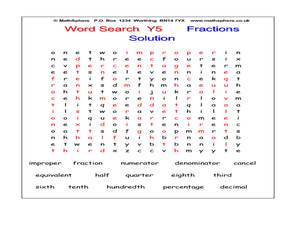
Word Search Y5 Fractions
In this fractions word search worksheet, learners locate and identify 15 fraction-related words in the word bank within the word search puzzle.
Curated OER
Pictures of Data
In this data worksheet, students look at maps and charts and answer multiple choice questions about them. Students complete 10 questions.
Curated OER
Meatiest States: Graph Problem Solving
In this graph problem solving activity, students analyze a graph that shows commercial red meat production in five states. Students answer 5 word problems using the data on the graph.
Curated OER
Binary Operations
In this binary operations worksheet, 7th graders solve and complete 12 different problems that include various types of binary operations. First, they determine if the operation used is commutative. Then, students name the identity...


