Curated OER
Great Graphing
Young scholars collect data, use a computer spreadsheet program to create various graphs, and compare the graphs. They state the findings of each graph in writing and decide which graph type best represents the data.
Curated OER
Charting Historical Gas Prices
Students investigate the historical and current prices of a gallon of gasoline. Using an online tool, they calculate the inflation-adjusted cost of gasoline over the years, and create a graph to demonstrate the actual cost vs. the...
Curated OER
Build a Skittles Graph
Students construct a bar graph with a given set of data. They calculate the ratio and percent of the data. Students discuss alternate ways of graphing the data as well as multiple strategies to approach the task.
Curated OER
My Test Book: Reading Pie Charts
In this math skills worksheet, students solve 9 multiple choice math problems that require them to read and interpret charts. Students may view the correct answers.
Curated OER
Creating Line Graphs
Students relate data to coordinate graphs and plot points on this graph. They use minimum wage data to construct the graph. Students decide appropriate time intervals for the graphs. They share graphs with their classmates.
Curated OER
Pie Charts
In this math worksheet, students complete the work in order to chart the data into the pie graph. The picture is used for statistical analysis.
Curated OER
Grasping Graphs
For this grasping graphs worksheet, students solve and complete 3 different types of problems. First, they graph the data described and select the appropriate graph type. Then, students identify the independent and dependent variable. In...
Curated OER
Graph Made Easy: Post Test
For this graphs worksheet, students answer multiple choice questions about line graphs and bar graphs. Students answer 10 questions total.
Curated OER
Thanksgiving Feast (Read the Charts)
Students practice reading charts about foods country of origin. They interpret information and answer questions related to charts. They discover how food production adds to the economy.
Curated OER
Introduction to Graphs: Bar Graphs, Line Graphs, Circle Graphs
In this graphing data worksheet, students answer 5 short answer questions about graphs. Students determine which type of graph best represents various data sets.
Curated OER
Which Graph is best?
Students use commercial software to organize and visually display data to draw conclusions; students use graphing software to create several types of graphs illustrating the number of each color of M&M's in one bag.
Curated OER
Line Graphs and Commercial Costs
Middle schoolers investigate line graphs. In this middle school mathematics lesson, students compare and contrast different types of graphs and create line graphs based on the data provided.
Curated OER
Line Graphs 4
In this graph learning exercise, students interpret given line graphs. They determine the range, and identify the range in a set of data. This one-page learning exercise contains approximately 14 problems.
Curated OER
Students Favorites
Students complete activities using a frequency table and construct a pie graph for the data. In this frequency table lesson plan, students complete a survey to find data for a frequency table. Students use the given link to make a pie...
Curated OER
Statistics of Mars
Students explore the concept of central tendencies. In this central tendencies lesson, students sort M&M's or Skittles based on color. Students graph their results. Students find the mean, median, and mode of their data.
Curated OER
Data Analysis Using Technology
Analyze data using technology. Middle schoolers design data investigations, describe data, and draw their own conclusions. Then they select the best type of graph, graph and interpret the data, and look for patterns in trends. They also...
Curated OER
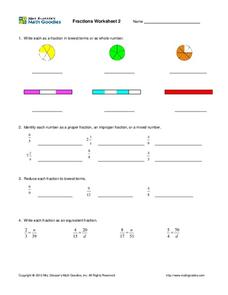
Fractions: pie graphs, numbers, and bars
In this fraction worksheet, students complete fraction problems containing pie graphs, numbers, bars, proper fractions, lowest terms, and more. Students complete 19 problems.
Curated OER
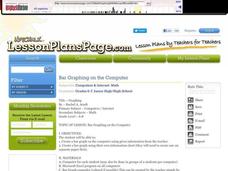
Graphing on the Computer
Students create a bar graph on the computer using given information from the teacher. They create a bar graph using their own information chart (they need to create one on separate paper first). They utilize Microsoft Excel for this...
Curated OER
Solving Multi-Step Problems
Use this multi-step problems worksheet to have your charges complete multi-step problems including money, fractions, charts, and more. They complete 30 problems total.
Curated OER
Statistics and Graphing with Accelerated Math
Students create charts and graphs, using a spreadsheet program, of their results from their accelerated math lessons. Students discover how graphs can be used to interpret data in our everyday lives as well as how several different...
Curated OER
Graph Lab
Seventh graders explore bar graphs and pie charts. Given a pack of M&Ms, 7th graders explore the colors, sort the data in a frequency chart and then construct bar graphs and pie charts to categorize the M&Ms by color. Students...
Education World
The African American Population in US History
How has the African American population changed over the years? Learners use charts, statistical data, and maps to see how populations in African American communities have changed since the 1860s. Activity modifications are included to...
Curated OER
Statistics with M&Ms
Seventh graders explore estimation, measurement, and probability. Students conduct surveys and create charts & graphs. They study the history of chocolate. Students design their own magazine advertisement or create a script for a...
Curated OER
Reading Graphs
Learners read graphs and charts to interpret results. In this algebra activity, students interpret bar, line and pictographs. They draw conclusions and make predicitons based on these charts.
Other popular searches
- Pie Charts and Graphs
- Reading Charts and Graphs
- Behavior Charts and Graphs
- Charts and Graphs Candy
- Interpret Charts and Graphs
- Charts and Graphs Christmas
- Charts and Graphs Math
- Analyzing Charts and Graphs
- Tables, Charts and Graphs
- Charts and Graphs Europe
- Using Charts and Graphs
- Bar Graphs and Charts


