Curated OER
Fabulous Fractals
Students view a video to discover how patterns in nature relate to math. They explore the concept of exponential growth by observing and creating fractals. They solve and design word problems.
Curated OER
Fractions: Jim and John
Elementary and secondary learners investigate various concepts related to the study of fractions. They use word problems during the introduction to parts of a fraction and proceed to some of the basic operations of using fractions. The...
Curated OER
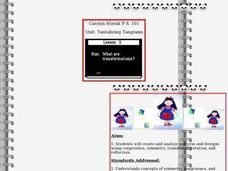
Tantalizing Tangrams: What Are Transformations?
Students use the Internet to learn about transformations and tessellations. In this geometry lesson, students use the Internet to define the meaning of reflections, translations, rotations, glide reflection and symmetry. Students...
Curated OER
Science in History Part I: the Abacus To the Modern Computer
In this math information worksheet, learners read one page factual accounts of the early math inventions of the abacus, the calculator and early computers. There are 40 questions to answer about the reading.
Curated OER
Nutrients by the Numbers
Students read and discuss an article on the amount of sugar in various food products. They compare the nutritional values of food products, calculate their daily intake of nutrients, analyze serving sizes, and compare/contrast their own...
Curated OER
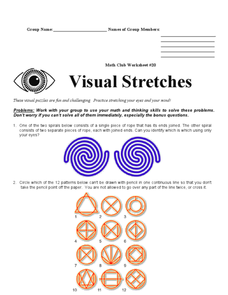
Math Club Worksheet #30 - Visual Stretches
In this visual math puzzle worksheet, students work in groups to find the answer to 6 math puzzles. They work with geometric shapes and symbols.
Curated OER
Probability
Sixth graders explore theoretical and experimental probability. In this probability lesson plan, 6th graders participate in several hands-on activities involving the comparison of theoretical probability to the actual results. Games...
Curated OER
Teaching Percentages
Students calculate percentages using the Percent Tricks method. They multiply and divide whole numbers. They count total number of candies in a bag and calculate the percent of each color.
Curated OER
Seeing Double
Students develop an intuitive definition for symmetry after viewing a PBS video. They examine asymmetrical patterns and demonstrate their knowledge by changing them to symmytrical.
Curated OER
What's Your Design?
Sixth grade students: design a stained glass window, submitting their initial plan detailing the measurements of all lines and angles. Seventh grade students: create a scale drawing of their own geometric family of four members.
Curated OER
Surface Area and Volume
Students are introduced to the notion of surface area and volume. Students review surface area and volume by finding the area of a two-dimensional shape. They practice using the computer to create different surface area shapes.
Curated OER
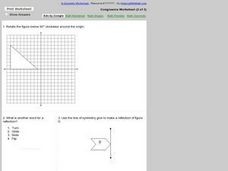
Rotations and reflections
In this rotations worksheet, students complete problems having to do with shapes and their rotations, reflections, symmetry, translations, and more. Students complete 6 problems.
Curated OER
Terrific Tessellations
Pupils explore tessellations that are found in nature and everyday objects. They observe the works of M.C. Escher. Students create their own tessellations using pencil and paper.
Curated OER
Canada's Climate: Temperature and Rainfall Variations
Middle schoolers analyze data about various climates in Canada. In this data analysis and climate lesson, students use Canada Year Book 1999 to complete a worksheet and make connections between precipitation and temperature in different...
Curated OER
Geometry: Calculating Volumes
For this volume worksheet, middle schoolers find the volume of 8 prisms. Students are given the length, width, and height of each prism.
Curated OER
Proportions in Flight
Sixth graders calculate wingspan and the body length of the birds and understand how they relate to how the bird flies. In this wingspan lesson plan, 6th graders also calculate their own "wing span" with their arms.
Curated OER
Cross Section and Slope
Students draw cross sections of given contour maps. In this math lesson, students interpret the different symbols used in the map. They determine slope and steepness through direct measurement.
Curated OER
Patterns In Fractals
Pupils find number patterns in the generation of several different types of fractals.
Curated OER
Geometry Scavenger Hunt
Young scholars use the digital camera, identify geometric shapes (in nature as well as man-made), and gain a better understanding of geometric vocabulary. They search for and recognize geometric shapes in unusual settings
Curated OER
"A Grain of Rice" by Helena Clare Pittman
Learners solve the problem that comes up in the story. They realize the explosive growth of the powers of 2.
Curated OER
No-More-In-A-Line
Learners and teacher discuss square windows and their symmetry. Students work on the problem given and discuss any difficult ideas. They work in groups to use a systematic approach to get all possible answers.
Curated OER
Efficiency Means Getting More for Less
Middle schoolers measure water and make predictions about efficiency.
Curated OER
Checking County Numbers
Students use their county's information page to gather information about their community. Using the information, they create graphs from the tables provided and interpret the data. They write a paragraph showing their interpretation of...
Curated OER
Meatiest States: Graph Problem Solving
In this graph problem solving worksheet, students analyze a graph that shows commercial red meat production in five states. Students answer 5 word problems using the data on the graph.
Other popular searches
- Congruent and Similar Shapes
- Similar Figures Proportions
- Congruent Similar Figures
- Geometry Similar Figures
- Geometry Similar Polygons
- Area of Similar Figures
- Congruent and Similar Figures
- Similar Polygons Proportion
- Ratios in Similar Polygons
- Similar Figures, Area
- Congruent & Similar Shapes
- Identifying Similar Polygons


