Curated OER
Linking Algebra to Temperature
Students convert between two units as they calculate the temperature. In this algebra lesson, students collect data on seasonal climate and create a graph. They make conjectures based on their data collection.
Curated OER
Line and Double Line Graphs: Reteach
In this graphing worksheet, students review the five steps for making a double line graph to display data. Students then use the graph they made following the shapes to answer the three questions.
Curated OER
Does More Wins Mean More Fans At The Ballpark?
Students, after getting information from the past baseball season off the Internet, calculate an attendance-to-win ratio for each of the 28 major league teams and then study the results to see if winning always leads to good attendance.
Curated OER
Functions in Motion
Students graph polynomials functions and analyze the end behavior. In this algebra lesson, student differentiate between the different polynomials based on the exponents. They use a TI to help with the graphing.
Curated OER
Negative and Positive Numbers
Help scholars explain the concept of positive and negative numbers. Here you will find three separate activities that will help them to correlate positive and negative numbers with real life. Note: Activities require that the teacher...
Curated OER
Mapping a Site Using a Coordinate Plane
Learners map their playground as if it were an archeological site. They locate objects on the playground and determine their location using coordinate points. A related instructional activity is Coordinate Grid: Mapping an Archeological...
Curated OER
Kinzi Deaf Alumni
Learners use data of school alumni to create a database. The lesson plan uses technology and access to a computer lab is essential. The concepts of graphing statistics is also used to help teach across the curriculum.
Curated OER
Coordinate Connections
Sixth graders complete several activities that involve coordinates and graph paper. They visualize and identify geometric shapes after applying transformations on a coordinate plane. Finally, 6th graders draw and label a coordinate...
Curated OER
Cantilevers
Students perform an experiment to find the linear relationship between the appllied weight and the bend of the cantilever. In this linear relationships activity, students follow detailed directions to set up an experiment. They add...
Curated OER
I'm Late, I'm Late, for a Radioactive Date!
Through the use of an interactive Web site, students explore C-14 and C-14 dating. Then students analyze an article written about the C-14 dating of the Shroud of Turin and draw conclusions.
Curated OER
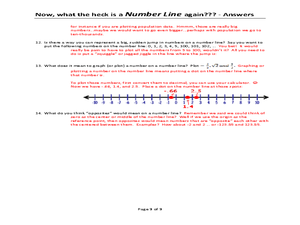
Now, what the heck is a NUMBER LINE again???
A unique approach to reviewing number lines and how to locate different values on them, this instructional activity poses several questions that require written answers rather than calculations. You could use this as a note-taking guide...
Curated OER
New York State Testing Programs Mathematics Test
In this math learning exercise, students review algebraic and geometric concepts as they review for the final exam of 6th grade. There are 35 questions.
Curated OER
Walking the Plank: Student Worksheet
For this math worksheet, students will work in a group to experiment with the weight of objects when placed at a distance from a scale (using a plank). Students will record and graph their results.
Curated OER
Using Math to Get to the Source
In this lead blood levels worksheet, learners use mathematics to determine the source of lead poisoning in children. They are given data, they analyze the data and they graph the blood level measurements vs. the mean blood lead level in...
Curated OER
Straight Graph Lines: Coordinates
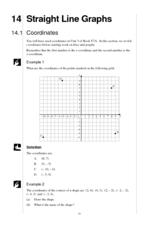
Students access prior knowledge of coordinates. In this coordinates lesson, students graph coordinate points to create a symmetrical figure and of a straight line. Students complete several practice examples.
Curated OER
Cross Section and Slope
Students draw cross sections of given contour maps. In this math lesson, students interpret the different symbols used in the map. They determine slope and steepness through direct measurement.
Curated OER
Histograms and Bar Graphs
Students are introduced to histograms, bar graphs, and the concept of class interval. They use an activity and three discussions with supplemental exercises to help students explore how data can be graphically represented (and...
Curated OER
"Homecoming" by Cynthia Voigt
Students use estimation skills to calculate distance traveled and then calculate walking rate traveled in MPH.
Curated OER
Sixth Grade Word Problems
In this word problem worksheet, 6th graders problems using given information and mathematical equations. Students solve for 19 problems showing work as needed.
Curated OER
Spaghetti Bridges
Students thread a piece of spaghetti through the holes in the cup. One person suspend the cup by placing each index finger approximately one inch in from the ends of the spaghetti.
Curated OER
More with Graphing and Intercepts
In this math worksheet, students graph the equations through recognizing the position of the intercepts. They also create a function table for each.
Curated OER
Skateboard Flex
Students examine statistics by completing a skateboard measuring activity. In this flex lesson plan, students define what skateboard "flex" refers to and identify the proper method of measuring flex by conducting an experiment with...
Curated OER
Negative & Positive Numbers
Students recognize positive and negative numbers and perform mathematical functions.
Curated OER
2 x 2
Students work together to grid a 2 x 2 meter unit using the formula for the Pythagorean Theorem. After creating the grid, they identify the location of artifacts and create a map of their location. They develop a graph and table of their...
Other popular searches
- Plotting Coordinates Picture
- Plotting Points Pictures
- Fun Plotting Points
- Plotting Points on Graphs
- Plotting Coordinates Maps
- Plotting Coordinates on Maps
- Plotting Points on a Graph
- Plotting Coordinates Graphs
- Plotting Points on a Grid
- Plotting Points Math
- Ell Math Plotting Points


