Curated OER
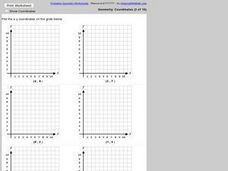
Plotting Coordinates on a Grid
In this plotting points on a graph worksheet, students plot 6 points on 6 graphs. Students plot x and y-coordinates in the first quadrant.
Curated OER
Scattered About
Middle schoolers are introduced to the concept of scatter plots after reviewing the various types of graphs. In groups, they analyze the type of information one can receive from a scatter plot and identify the relationship between the x...
Curated OER
Pizza Possibilities
Students create and interpret line plots, bar graphs, and circle graphs. The instructional activity assumes mastery of conversions from fraction to decimal to percent, construction of angles, and at least an introduction to graphs...
Curated OER
Perplexing Puzzles
Elementary and middle schoolers explore scatter plots. In this graphing lesson, pupils work in small groups and use jigsaw puzzles to develop a scatter plot. Younger students may develop a bar graph.
Curated OER
Data Analysis: Graphs, Charts, Tables, Statistics
In this data analysis worksheet, students interpret data in 5 problems involving graphs, tables, and scatterplots. Students construct 1 stem and leaf plot and find the mean, median, and mode of a data set.
Curated OER
Graphing Greenery
Students gather leaves and trace them on graph paper. They plot coordinates that approximate the shape of the leaves and share those coordinates as "worksheets" for other students to complete.
Curated OER
Fire!, Probability, and Chaos
Upper elementary and middle schoolers work with the concept of probability. They are introduced to the concept of chaos. Learners graph and analyze using a line plot, work with mean, and are introduced to the concept of variance.
Illustrative Mathematics
Puppy Weights
Nobody can say no to puppies, so lets use them in math! Your learners will take puppy birth weights and organize them into different graphs. They can do a variety of different graphs and detail into the problem based on your classroom...
US Department of Commerce
Does the Percentage of People Who Walk to Work in Cities Vary with Population Size?
To walk or not to walk? Pupils create box plots comparing the percentage of residents who walk to work in large, medium, and small cities. Using the box plots, class members compare the data that reflects available statistics. Scholars...
New Mexico State University
Creature Caverns
Plot the relationship of characteristics of creepy creatures. Learners plot the coordinates to describe the number of eyes, horns, and/or brains different creatures have. Pupils fill out a table to plot the points and complete the pattern.
American Statistical Association
EllipSeeIt: Visualizing Strength and Direction of Correlation
Seeing is believing. Given several bivariate data sets, learners make scatter plots using the online SeeIt program to visualize the correlation. To get a more complete picture of the topic, they research their own data set and perform an...
CK-12 Foundation
Ordered Pairs in Four Quadrants
One quadrant just isn't enough. Pupils learn to plot points in the four quadrants of a coordinate plane using an interactive. A set of challenge questions tests their understanding of the skill.
Curated OER
Plotting Coordinates
In this geometry skills learning exercise, students plot the listed coordinates on the provided graphs in order to identify the appropriate shapes.
Curated OER
Mean Absolute Deviation in Dot Plots
The lesson focuses on the ideas of dot plot representations and the mean absolute deviation of data sets.
Curated OER
You Can Get There From Here - Plotting on a Coordinate Plane
For this plotting worksheet, learners plot given ordered pairs on a coordinate plane. After plotting each ordered pair, students connect line segments in consecutive order. Upon completion of the graphing exercise, learners will have...
Arizona Department of Education
Introduction to Integers
Welcome to the backward world of negative numbers. This introductory lesson teaches young mathematicians that negative numbers are simply the opposite of positive numbers as they use number lines to plot and compare single-digit integers.
Curated OER
Students Analyze Data With Scatter Plots
Scatter plot lessons can help students create different types of graphs by hand or with the aid of technology.
Curated OER
Plot the Coordinates to Create a Letter!
In this coordinates worksheet, students plot and connect coordinates on graphs to create a letter, 2 graphs total. A reference web site is given for additional activities.
Curated OER
Introduction to Representing and Analyzing Data
Represent data graphically. Allow your class to explore different methods of representing data. They create foldables, sing songs, and play a dice game to reinforce the measures of central tendency.
Curated OER
Plot the x-y Coordinates on the Grids Below
In this coordinate grid graphing worksheet, students plot the given points onto each of 6 coordinate grids. All points are located in quadrant 1. One point is plotted on each grid. Answers are given by clicking the appropriate place on...
Curated OER
Graphs
In this graph activity, 6th graders have to identify the given points, and plot them on the empty graph. Students identify 8 points.
Curated OER
Points on a Graph
In this points on a graph worksheet, students are given the coordinates and they have to plot the points and connect the dots. Students plot 8 points on the graph.
Curated OER
Shedding Light on the Weather with Relative Humidity
Learners study weather using a graphing calculator in this lesson. They collect data for temperature and relative humidity for every hour over a day from the newspaper, then place the data in their handheld calculator and examine it for...
Curated OER
What's Your Speed?
Learners explore the concept of distance v. time. They use a CBR to collect data on their distance over time, then plot their data using a scatter plot and find an equation to model their data. Pupils discuss what if scenarios which...
Other popular searches
- Line Plots
- Scatter Plots
- Stem and Leaf Plots
- Box and Whisker Plots
- Box Plots
- Frequency Tables Line Plots
- Scatterplot
- Dot Plots
- Math Scatter Plots
- Line Plots Grade 3
- Stem and Leaf Plots
- Box Whisker Plots


