Curated OER
Negative & Positive Numbers
Students recognize positive and negative numbers and perform mathematical functions.
Curated OER
Track's Slippery Slope
Learners graph data of sports figure running time using x-axis y-axis to find slope of trend line, mathematically find the interpolated and extrapolated values for data points. Using the information they make predictions.
Curated OER
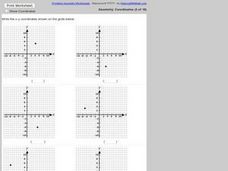
Identifying Points in the Coordinate Plane
In this ordered pairs worksheet, students identify 6 ordered pairs given a coordinate plane. Students list the ordered pair given the graph.
Curated OER
Olympic records through time
Young scholars compare the records of gold medal Olympic winners for the last 100 years and decide if we are faster, stronger than in the past.
Curated OER
Raisin Cane
Students estimate and record the number of raisins in a snack-size box. They also graph their results and note the differences (+ or -) from their estimate and actual number.
Curated OER
Weather Chart
Students select at least 6 cities from around the world to keep track of their high and low temperatures over a period of time.
Curated OER
The Great Turkey Walk
Students formulate questions that can be addressed with data and collect, organize, and display relevant data to answer them. They wcreate bar graphs and pie graphs
Curated OER
Charting Attendance Rate of Busch Gardens
Sixth graders, in groups, are given different parts of the whole project. They use information from Busch Gardens to explore line graphs, averages, and other math vocabulary.
Curated OER
Data Shuffle
Young scholars find an advertisement or newspaper using charts or graphs. They create another graph using the same information in a different format. They write a comparison of the two graphs.
Curated OER
Math and Science in a Wetland
Students describe safe practice when doing field and lab investigations in a estuary or wetland. They create a model of an estuary and describe their value and function. They participate in field study in which they collect and analyze...
Curated OER
Scavenger Hunt
Students collect data about lighting conditions around a room using a light sensor and RCX. They use software to upload and analyze the data in order to draw conclusions about light intensity in the room.
Curated OER
2 x 2
Middle schoolers work together to grid a 2 x 2 meter unit using the formula for the Pythagorean Theorem. After creating the grid, they identify the location of artifacts and create a map of their location. They develop a graph and table...
Curated OER
All Aboard!
Students are placed in the position of the person who orders supplies for the ship. They calculate quantities required for a variety of items, and then to convert such quantities into dollars.
Curated OER
Exploring Geometric Patterns and Relationships
Sixth graders explore different geographic relationships in like drawing lines, rays, and parallelograms. This lesson could be used for review because it covers more than one concept. The students should have prior knowledge.
Curated OER
Points in the Complex Plane -- Lab
Middle schoolers review the lecture portion of this lesson. Individually, they graph various points on a complex plane and identify conjugates based on their location on the graphs. They complete a worksheet and review their answers to...
Curated OER
Reading Points on a Graph
For this reading points on a graph worksheet, students read and identify points on a coordinate plane. They place their answers in the form of an ordered pair. Students identify 20 points. They may enter their answers on the webpage...
Curated OER
Graph Functions: Practice
In this graph functions activity, learners complete several activities to help them graph functions. Students use the table and the graph to complete the questions. Learners also answer two test prep questions.
Curated OER
Survey and Share
Students practice collecting data by surveying other students. In this data collection lesson plan, students decide on a question and collects data from 15 other students. Eventually the students will end up graphing their results.
Curated OER
Math Maven's Mysteries: Race Against Captain Devious
In these math word problem worksheets, students help solve the mystery about the 'Race Against Captain Devious.' Students must solve the distance travel word problem using kilometers and rounding their answers to the nearest whole number.
Curated OER
Straight Line Graphs
Young scholars discover certain equations produce straight lines. In this graphing lesson, students draw axis and problem solve to find coordinates to graph.
Curated OER
MOBILITY, Traveling Lightly: What’s My Footprint?
Students calculate their carbon footprint. In this environmental technology lesson, students listen to a lecture on climate change. Students brainstorm solutions to reduce environmental impact based on travel options. Students calculate...
Other popular searches
- Line Plots
- Scatter Plots
- Stem and Leaf Plots
- Box and Whisker Plots
- Box Plots
- Frequency Tables Line Plots
- Scatterplot
- Dot Plots
- Math Scatter Plots
- Line Plots Grade 3
- Stem and Leaf Plots
- Box Whisker Plots


