Curated OER
The Cartesian Plane
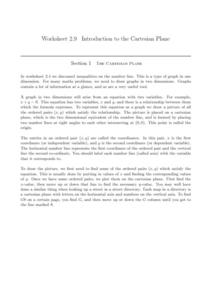
Learners solve and complete 22 various types of problems. First, they find the gradients of the lines and plot the given points. Then, they complete the table of values for each equation and use the table to draw the graph.
Curated OER
Geometry- Coordinate Plane
Students plot points on a coordinate grid. In this coordinate plane lesson, students use a coordinate grid to locate the perimeter points of pictures, identify quadrants and use the coordinate points to draw the picture on a blank...
Curated OER
Coordinate Geometry
Grab your class and get them graphing polygons on a coordinate plane! They investigate the four quadrants, discover the x and y axis, and correctly plot ordered pairs. To show their comprehension, each child creates a coordinate picture...
Curated OER
Fishing for Points
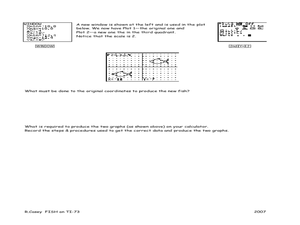
Learners explore the concept of ordered pairs. In this ordered pairs lesson, pupils list the ordered pairs of a graph in the shape of a fish. They use their calculator to translate the fish using lists, then translate the fish left,...
Curated OER
Physics: Vector Addition
Young scholars drill and practice putting problems into vector form. They draw each problem before trying to solve them. Students draw arrows for any vector quantities to indicate magnitude and direction.
Curated OER
Froot Loop to the Max - Ordered pairs
In this Froot Loop to the Max worksheet, students complete 21 different sets of ordered pairs. They plot each of the ordered pairs listed on the sheet, connecting them in order from #1 through #21. Then, students determine whether it is...
Curated OER
How Much Will I Spend On Gas?
Students construct a linear graph. In this graphing lesson, students determine a monthly budget for gasoline. Students construct a t-chart and coordinate graph to display data. Resources are provided.


