Curated OER
The Difference Bar 2
Students use Internet software, The Difference Bar, to work out the difference between two numbers by breaking numbers into parts. Students use mental strategies to work out the difference between any 2 two-digit numbers. Students...
Curated OER
Take Away Bar 2
Students use an Internet tool, The Take-Away Bar" to solve subtraction problems. They use mental strategies to subtract a two-digit number from a larger two-digit number. Students write and solve subtraction problems. They describe...
Curated OER
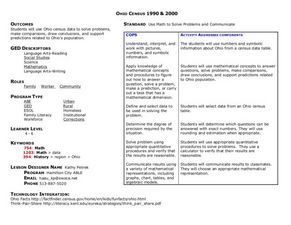
Ohio Census 1990 and 2000
Students begin the lesson plan by examining Census data from the state of Ohio from 1990 and 2000. Using a worksheet, they solve problems using the data and a calculator. They share their responses with the class and discuss what the...
Curated OER
Football Statistics
In this math worksheet, learners examine the statistical information as provided in the graphic organizer and calculate the other values.
Curated OER
Money, Decimals and Fractions (UK Currency)
In this math worksheet, students solve 24 word problems about UK pounds and pence. These problems about English currency involve decimals and fractions.
Curated OER
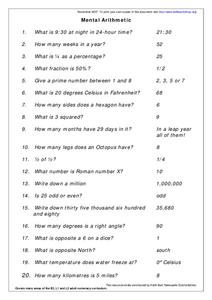
Mental Arithmetic
In this math worksheet, students are read a series of questions. They answer them mentally. The questions and answers are on the worksheet.
Curated OER
Arkansas and the Civil Rights Movement
In this Arkansas reading comprehension worksheet, students read a 2-page selection regarding the state and the Civil Rights Movement and they answer 10 true or false questions pertaining to the selection.
Curated OER
Meatiest States: Graph Problem Solving
In this graph problem solving worksheet, students analyze a graph that shows commercial red meat production in five states. Students answer 5 word problems using the data on the graph.
Curated OER
Handling Data: Comparing Distributions
Students gather information by analyzing graphs, diagrams and pie charts. In this graphs and diagrams lesson, students complete addition and subtraction problems. Students discuss a pie chart. Students use information to crate a stacked...
Curated OER
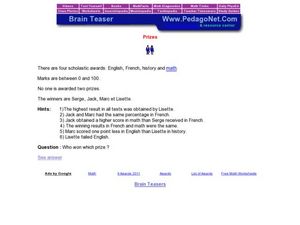
Brain Teaser -"Prizes"
In this brain teaser worksheet, students solve 1 brain teaser word problem. A website reference is given for additional activities.
Other popular searches
- Teaching Percentages
- Figuring Percentages
- Calculating Percentages
- Basic Money Percentages
- Math Percentages
- Markup Percentages
- Discount Percentages
- Decimals and Percentages
- Percentages and Math
- Math Lessons on Percentages
- Circle Percentages
- Percentages of Quantities


