Curated OER
Class Opinions on Renewable Energy
In this renewable energy worksheet, students put an X on their opinion on the energy source that will help the Earth's problems. Students have 5 energy sources to choose from and then complete math problems based on the results.
Curated OER
Getting to Know You
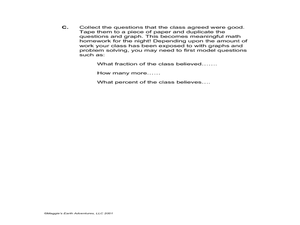
Learners create survey questions for their classmates. In this survey activity, students pick a yes or no question and find what fraction of the class responded yes. They discover how the wording of a survey question can affect the answer.
Curated OER
Calculating Tips
In this calculating tips worksheet, students determine how much should be tipped on amounts spent at restaurants.
Curated OER
A Woman's Place?
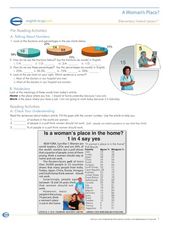
In this women workers lesson, students read an article about women in the workforce and answer 10 questions related to the article. They also convert fractions to percentages.
Curated OER
Load! Ready! Fire!
Learners will identify the parts of a cannon and practice demonstrating a mock firing. In this math and science lesson, students read background information on the cannon and its firing. Learners read about and role play positions near...
Curated OER
Population Ratios
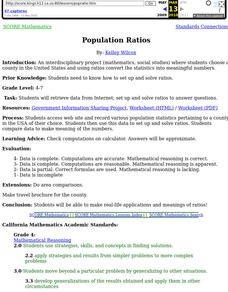
Young scholars access web site and record various population statistics pertaining to a county in the USA of their choice. They use this data to set up and solve ratios. They compare data to make meaning of the numbers.
Curated OER
Statistics and Shopping
Learners examine statistics and data analysis concepts from the practical questions that arise in everyday life.
Curated OER
Area graphics for 7th graders
Students randomly select dimensions for three geometric shapes (square, right triangle and circle). From the graphs they compare and contrast the graphical results of each shape.
Curated OER
Science: Breathing in Space
Students determine the amount of air they use during rest and activity. They conduct experiments to calculate the number of breaths needed to empty a jug of water by exhaling through a tube into the container. Then, they figure how much...
Curated OER
Cannot Buy Me Love
Pupils investigate the concepts that are related to finance and how it is used in the world. They take part in activities that are focused around the use of a spreadsheet while using a T-chart to simulate a ledger of credits and debits.
Curated OER
Expected Value
Students explore expected value, are introduced to the concept of varying payoffs, and have used a computer simulation of a "real world" example where expected value is used
Curated OER
Walk a Mile in Albatross Shoes
Students recognize the correlation between the trash they dispose of around their school and the environmental hazards that face wildlife, specifically the Laysan albatross. They determine three ways that they can help the albatross chicks.
Curated OER
Make a Difference
Middle schoolers are introduced to the resource economies of recycling aluminum cans. They develop understanding about their own impact on the amount of solid waste produced and recognize the impact of recycling on energy and natural...
Curated OER
Flying with Fractions
Students test their knowledge of the Wright Brothers and their aircraft, and compute ratio of two numbers to determine the ratio between wing span and length of aircraft.
Curated OER
Stars and Stripes
Students design a United States flag using reasoning. They describe their design to make it easy for it to be duplicated. They share their designs with the class.
Curated OER
Weather Plots
Students investigate the relationship between temperature and humidity. The graphs of weather data gathered and plotted for for an assigned period of time are analyzed and the interpretations shared with the class.
Curated OER
Island Hopping
Students utilize a variety of math skills to explore the Turks and Caicos Islands, the British Territory to which South Caicos belongs. They select and apply quantitative data to support their recommendations for future investment and...
Curated OER
Properties of Fractals
Students build a working definition of a regular fractal, they measure the concepts of dimensions and scale, they explore the concept of a logarithm and they attempt to solve simple exponential equations for the exponent both by trial...
Curated OER
Irregular Fractals
Middle schoolers study and research irregular fractals and construct a few based on their research. Students practice pattern recognition skills and plane geometry skills calculating dimensions on the Fractured Pictures activity.
Curated OER
Theoretically Speaking
Students define probability. They determine outcome from a given situation based on simple probability. Students create experimental data using a coin and a number cube. They write how theoretical and experimental probability are different.
Curated OER
Estimating for Accuracy
Students are introduced to the topic of estimation. Using various methods, they estimate and calculate the answers with the use of a calculator. They develop a practice to always estimate answers involving percentages and use a...
Curated OER
Arkansas and the Civil Rights Movement
In this Arkansas reading comprehension worksheet, students read a 2-page selection regarding the state and the Civil Rights Movement and they answer 10 true or false questions pertaining to the selection.
Curated OER
Meatiest States: Graph Problem Solving
In this graph problem solving worksheet, students analyze a graph that shows commercial red meat production in five states. Students answer 5 word problems using the data on the graph.
Other popular searches
- Percentages
- Fractions Decimals Percents
- Percent Circle Graph
- Percent Fractions Decimals
- Fraction Decimal and Percent
- Fraction Percents
- Percent Proportion
- Ratios Percent
- Ratios and Percents
- Decimals and Percents
- Percent Word Problems
- Percent of a Number


