Curated OER
Do the Elephants Need Sunscreen? A Study of the Weather Patterns in Etosha
Students analyze the weather patterns in Namibia. They create a graph of the yearly temperatures and use the internet to gather information. They discuss how the weather goes in cycles in the area.
Alabama Learning Exchange
Investigating Friction
Young learners explore friction. They view a video or DVD (bibliography provided) and define terms related to friction, and work in groups to experiment with the effects of friction on speed and motion using ramps and toy cars.
Curated OER
L-shaped Perimeters
In this perimeter worksheet, learners calculate the perimeter of L-shaped figures by subtracting to find missing side lengths. There are 6 questions.
Curated OER
Data and charts
In this data and charts worksheet, students answer multiple choice questions referring to different charts about mountain heights, breakfast drinks, and more. Students complete 10 multiple choice questions.
Curated OER
Childhood Obesity
Students identify a question to generate appropriate data and predict results. They distinguish between a total population and a sample and use a variety of methods to collect and record data. Students create classifications and ranges...
Curated OER
Aruba Cloud Cover Measured by Satellite
Students analyze cloud cover and to compose written conclusions to a given related scenario. They submit a letter of response and a report detailing their calculations and conclusions.
Curated OER
Mystery Graphs
Young scholars study graphs and learn how to display information into a graph. In this graph lesson plan, students construct a graph of their own sorted data, and pick out things in graphs that are inconsistent.
Curated OER
Survey and Share
Young scholars practice collecting data by surveying other students. In this data collection lesson plan, young scholars decide on a question and collects data from 15 other students. Eventually the young scholars will end up graphing...
Curated OER
Linking Algebra to Temperature
Students convert between two units as they calculate the temperature. In this algebra lesson, students collect data on seasonal climate and create a graph. They make conjectures based on their data collection.
Curated OER
How Much Will I Spend On Gas?
Students construct a linear graph. In this graphing lesson, students determine a monthly budget for gasoline. Students construct a t-chart and coordinate graph to display data. Resources are provided.
Curated OER
Follow That Ship!
Learners in this exercise are introduced to the distinct ways of measuring distance (nautical miles) and speed (knots) at sea, as well as the concepts of latitude and longitude for establishing location.
Curated OER
A Statistical Look at Jewish History
Students complete their examination over the Jewish Diaspora. Using population figures, they discover the importance of percentages in exploring trends. They use their own ethnic group and determine how it is represented in the United...
Curated OER
More Students Taking Online Courses
In this graph worksheet, students study a bar graph that shows the number of college students taking at least one online course. Students answer 4 problem solving questions about the data on the graph.
Curated OER
Graph Functions: Practice
In this graph functions learning exercise, students complete several activities to help them graph functions. Students use the table and the graph to complete the questions. Students also answer two test prep questions.
Curated OER
Estimation and Pattern Discovery
Pupils collect sunflower heads from their community garden. They estimate its seed count using different strategies. They graph their estimations on a graph and use calculators to find the actual total.
Curated OER
Scavenger Hunt
Students collect data about lighting conditions around a room using a light sensor and RCX. They use software to upload and analyze the data in order to draw conclusions about light intensity in the room.
Curated OER
Raisin Cane
Young scholars estimate and record the number of raisins in a snack-size box. They also graph their results and note the differences (+ or -) from their estimate and actual number.
Curated OER
The Bigger they Are . . .
Young scholars do a variety of data analyses of real-life basketball statistics from the NBA. They chart and graph rebounding, scoring, shot blocking and steals data which are gathered from the newspaper sports section.
Curated OER
Identifying Points in the Coordinate Plane
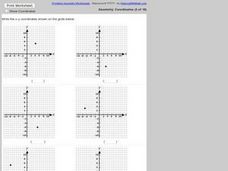
In this ordered pairs worksheet, learners identify 6 ordered pairs given a coordinate plane. Students list the ordered pair given the graph.
Curated OER
Surface Meteorological Observation System (SMOS)
Students monitor local surface weather conditions for at least 30 days. They interpret the data by graphing it and detemining percentages.
Curated OER
Olympic records through time
Students compare the records of gold medal Olympic winners for the last 100 years and decide if we are faster, stronger than in the past.
Curated OER
Data Shuffle
Middle schoolers find an advertisement or newspaper using charts or graphs. They create another graph using the same information in a different format. They write a comparison of the two graphs.


