Curated OER
Lost King of the Maya
Students are introduced to the Mayan Long Count calendar system. They work in groups to calculate the date of their birth and use the calendar to determine important Mayan dates.
Curated OER
Fractions and Ribbons
Sixth graders explore using inverse operations to solve decimal and fraction problems. In this decimal and fraction instructional activity, 6th graders prepare ribbon for a part and need to cut it in equal lengths. Students analyze the...
Curated OER
Geometric Transformations
Learners examine images and preimages of a mapping and identify isometry. They view images by M.C. Escher, observe teacher demonstrations, and create a translation image, a rotation image, and a dilation.
Curated OER
Shape Tool
Students explore various polygons and examine how shapes can be manipulated in a variety of ways. In this shape tool instructional activity, students identify geometric shapes in two dimensions. Students identify and draw one line of...
Curated OER
Usage and Interpretation of Graphs
Young scholars review graphing and use processing skills to solve problems.
Curated OER
Charting Weight
Sixth graders record the weight of themselves and 3 family over a week, and then use that data to compile 2 bar graphs and 4 line graphs and answer a series of questions.
Curated OER
Measurement and the Illampi Mound Colony
Students comprehend the basic units of measurement, scale, plotting, and basic grids. Students practice their estimation
and measuring skills and will demonstrate their ability to work well in groups.
Curated OER
Introduction to functions
In this functions worksheet, students plot points on a graph according to the rule. Students plot 7 points on each of the 2 graphs given to them.
Curated OER
Graphing Points: Post Test
In this graphing points worksheet, students answer multiple choice questions about the points on a given graph. Students answer 10 questions total.
Curated OER
Interpreting Graphs
Learners investigate graphs. In this graphing lesson, students create a graph regarding the population of California. Learners extrapolate answers concerning the data set.
Curated OER
Skateboard Flex
Middle schoolers examine statistics by completing a skateboard measuring activity. In this flex lesson plan, students define what skateboard "flex" refers to and identify the proper method of measuring flex by conducting an experiment...
Curated OER
Slope Right Up
Middle schoolers use triangles to find the length and slope of each side. After connecting the vertices, they add points based on their specific instructions. They use the Pythagorean Theorem to complete a worksheet to end the lesson.
Curated OER
Functions Made Easy
Students explore concept of functions as relationships, as machines, as equations, and as graphs.
Curated OER
Hurricane Tracking
Students access the Internet to find information on current hurricanes. They get locations, speeds, and air pressures and then plot the location of the hurricane on a hurricane-tracking map. They also access the FEMA website to solve...
Curated OER
Virtual Reality Construction Project
Students utilize the technology of virtual reality in order to perform a construction project. The construction has to do with the making of a reality scene using special Apple Virtual Reality software.
Curated OER
Number lines and graphs
In this number lines and graphs worksheet, students identify points on a number line and in a graph. Students complete 10 multiple choice questions.
Curated OER
High and Low Tides
Students collect real world data from the Web regarding high and low tides at various locations in the United States. They find a function which models this data and make predictions on tide levels based on the information found.
Curated OER
Estimation, Sampling, and Beyond
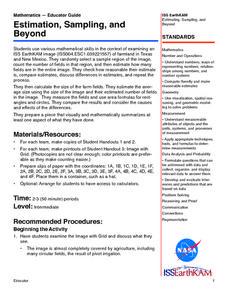
Students examine an ISS EarthKAM image of farm land in Texas and New Mexico. They select sample region of image and count the number of fields in that region. They estimate how many fields are in the entire region.
Curated OER
What's Your Design?
Sixth grade learners: design a stained glass window, submitting their initial plan detailing the measurements of all lines and angles. Seventh grade students: create a scale drawing of their own geometric family of four members.
Curated OER
Rebuilding The World Trade Center Site: A 9/11 Tribute
Students work together to build a memorial for the World Trade Center victims. In groups, they draw designs on what they believe the memorial should look like and write a proposal for the structure. To end the lesson, they present...
Curated OER
Building Blocks
Young scholars navigate to various websites and play educational games to reinforce learning. In this game lesson, students catalog games to play in various areas of the curriculum;. Young scholars play online and board games.
Curated OER
Graphing Points: Pre Test
In this graphing points worksheet, students complete multiple choice questions about axis's on a graph and points on a graph. Students complete 10 questions total.
Curated OER
Problem Solving Using Power Polygons
Students investigate geometric shapes by creating figures on a plane. In this polygon lesson, students complete a worksheet based on the angles in a power polygon. Students identify the different types of polygons and define their...
Curated OER
Linking Algebra to Temperature
Students convert between two units as they calculate the temperature. In this algebra instructional activity, students collect data on seasonal climate and create a graph. They make conjectures based on their data collection.
Other popular searches
- Halloween Math Coordinates
- Christmas Math Coordinates
- Math Coordinates Picture
- Math Coordinates Animals
- Fifth Grade Math Coordinates
- Math Coordinates Game
- Math Coordinates Sailboat
- Grid Coordinates in Math
- Coordinates in Math


