Curated OER
Mean Absolute Deviation in Dot Plots
The lesson focuses on the ideas of dot plot representations and the mean absolute deviation of data sets.
Curated OER
Surfing Amusement parks
Students must surf the Internet to find out how much it cost for his or her family to go to amusement parks in California.
Curated OER
Surface Area
Sixth graders compute the surface area. In this surface area lesson students are given a set of problems to calculate. They compute the surface area of cubes and rectangular boxes.
Curated OER
How Far Did They Go?
Students create a map. In this direction and distance lesson, students come up with familiar places in the community and calculate the distances from these places to the school. Students create a map that displays these places and their...
Curated OER
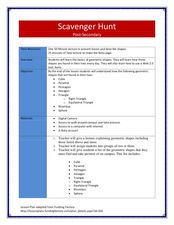
Scavenger Hunt
Students collect data about lighting conditions around a room using a light sensor and RCX. They use software to upload and analyze the data in order to draw conclusions about light intensity in the room.
Curated OER
ACC Basketball Statistics
Middle schoolers use math skills and create a spreadsheet. In this statistics and computer skills lesson, students gather ACC basketball statistics, convert fractions to decimals and then percents. Middle schoolers use the gathered...
Curated OER
Spaghetti Bridges
Students thread a piece of spaghetti through the holes in the cup. One person suspend the cup by placing each index finger approximately one inch in from the ends of the spaghetti.
Curated OER
A Statistical Look at Jewish History
Students complete their examination over the Jewish Diaspora. Using population figures, they discover the importance of percentages in exploring trends. They use their own ethnic group and determine how it is represented in the United...
Curated OER
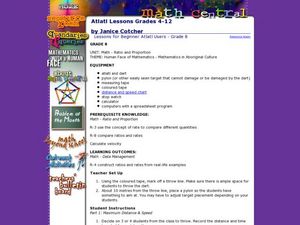
Atlatl Lessons Grade 4-12
Students experiment with velocity, ratios, and rates. In this data management lesson, students throw a dart with and without using an atlatl and collect and record various data. Students construct ratios based on the data and determine...
Curated OER
Rate It - Working With Positive and negative Numbers
Students practice rating things using numbers between -2 to 2. In this rating lesson, students determine what a rating scale is before rating things such as the weather, a book, or a day using the numbers -2 to 2. They examine the use of...
Curated OER
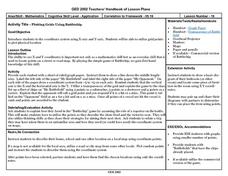
Plotting Grids Using Battleship
Students coordinate grid points on X and Y axises to plot a physical location. The game of "Battleship is used to present first hand knowledge of this skill.
Curated OER
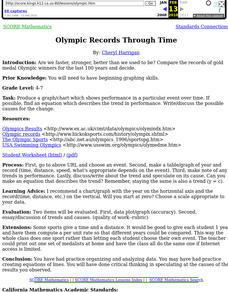
Olympic records through time
Learners compare the records of gold medal Olympic winners for the last 100 years and decide if we are faster, stronger than in the past.
Curated OER
Eye From the Sky
Students are introduced to the concept of aerial perspective and scale. Students will use satellite technology to view their neighborhoods and sketch the area surrounding their schools. They will take part in a neighborhood walk to view...


