Curated OER
Operations and Coordinates: The Coordinate System
Students play a "Battleship" type of game to practice graphing on a coordinate grid. In this graphing lesson plan, students listen as the teacher explains quadrants and ordered pairs. They place their "ships" on the board. The teacher...
Curated OER
Fractions and Ribbons
Sixth graders explore using inverse operations to solve decimal and fraction problems. In this decimal and fraction instructional activity, 6th graders prepare ribbon for a part and need to cut it in equal lengths. Students analyze the...
Curated OER
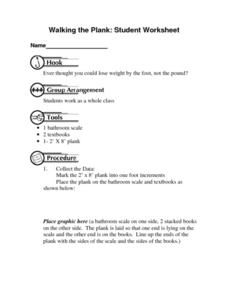
Walking the Plank: Student Worksheet
In this math worksheet, students will work in a group to experiment with the weight of objects when placed at a distance from a scale (using a plank). Students will record and graph their results.
Curated OER
New York State Testing Programs Mathematics Test
In this math worksheet, students review algebraic and geometric concepts as they review for the final exam of 6th grade. There are 35 questions.
Curated OER
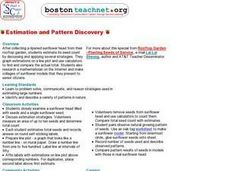
Estimation and Pattern Discovery
Learners collect sunflower heads from their community garden. They estimate its seed count using different strategies. They graph their estimations on a graph and use calculators to find the actual total.
Curated OER
Do the Elephants Need Sunscreen? A Study of the Weather Patterns in Etosha
Students analyze the weather patterns in Namibia. They create a graph of the yearly temperatures and use the internet to gather information. They discuss how the weather goes in cycles in the area.
Curated OER
Problem-Solving Decisions: Choose the Operation
In this problem solving activity, students read a story problem about the temperature at different altitudes. Students fill out an organization chart to understand the problem, plan a strategy, and then solve it.
Curated OER
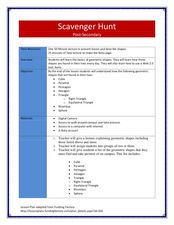
Scavenger Hunt
Students collect data about lighting conditions around a room using a light sensor and RCX. They use software to upload and analyze the data in order to draw conclusions about light intensity in the room.
Curated OER
Raisin Cane
Students estimate and record the number of raisins in a snack-size box. They also graph their results and note the differences (+ or -) from their estimate and actual number.
Curated OER
Survey and Share
Students practice collecting data by surveying other students. For this data collection lesson plan, students decide on a question and collects data from 15 other students. Eventually the students will end up graphing their results.
Curated OER
Fore!
In this golf worksheet, students fill in data in a chart about 6 tournaments and answer short answer questions about it. Students fill in 18 spaces in the chart and answer 2 questions.
Curated OER
Linking Algebra to Temperature
Students convert between two units as they calculate the temperature. In this algebra instructional activity, students collect data on seasonal climate and create a graph. They make conjectures based on their data collection.
Curated OER
How Much Will I Spend On Gas?
Students construct a linear graph. In this graphing lesson, students determine a monthly budget for gasoline. Students construct a t-chart and coordinate graph to display data. Resources are provided.
Curated OER
Spaghetti Bridges
Students thread a piece of spaghetti through the holes in the cup. One person suspend the cup by placing each index finger approximately one inch in from the ends of the spaghetti.
Curated OER
Follow That Ship!
Students in this exercise are introduced to the distinct ways of measuring distance (nautical miles) and speed (knots) at sea, as well as the concepts of latitude and longitude for establishing location.
Curated OER
A Statistical Look at Jewish History
Students complete their examination over the Jewish Diaspora. Using population figures, they discover the importance of percentages in exploring trends. They use their own ethnic group and determine how it is represented in the United...
Helping with Math
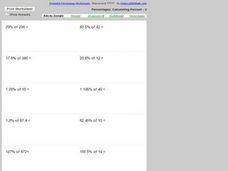
Percentages: Calculating Percent - 2
Here is a worksheet on which math classes practice calculating the percentage of different numbers. Some of the percentages involve decimals, so this would not be an assignment for first-time percent calculators! You can print the...
Curated OER
More Students Taking Online Courses
In this graph worksheet, students study a bar graph that shows the number of college students taking at least one online course. Students answer 4 problem solving questions about the data on the graph.
Helping with Math
Ratio and Proportion: Simplifying Ratios (1 of 2)
Here is a set of 24 pairs of numbers for which kids reduce the ratios to their simplest form. It is a simple and straightforward assignment, meant by the publisher to address CCSS.Math.Content.6.RP.3. Note, however, that it only requires...
Curated OER
The Bigger they Are . . .
Students do a variety of data analyses of real-life basketball statistics from the NBA. They chart and graph rebounding, scoring, shot blocking and steals data which are gathered from the newspaper sports section.
Curated OER
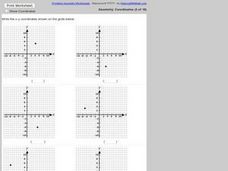
Identifying Points in the Coordinate Plane
In this ordered pairs worksheet, learners identify 6 ordered pairs given a coordinate plane. Students list the ordered pair given the graph.
Curated OER
Surface Meteorological Observation System (SMOS)
Students monitor local surface weather conditions for at least 30 days. They interpret the data by graphing it and detemining percentages.
Curated OER
Graph Functions: Practice
In this graph functions worksheet, students complete several activities to help them graph functions. Students use the table and the graph to complete the questions. Students also answer two test prep questions.
Curated OER
Olympic records through time
Learners compare the records of gold medal Olympic winners for the last 100 years and decide if we are faster, stronger than in the past.
Other popular searches
- Frequency Tables Line Plots
- Line Plots Grade 3
- Math Line Plots
- Christmas Line Plots
- Line Plots and Tallies
- Activities Using Line Plots
- Data Analysis Line Plots
- Human Line Plots
- Ell Math Line Plots
- Line Plots With Airplanes
- Charts, Tables, Line Plots
- Charts Tables Line Plots


