Education Development Center
Points, Slopes, and Lines
Before graphing and finding distances, learners investigate the coordinate plane and look at patterns related to plotted points. Points are plotted and the goal is to look at the horizontal and vertical distances between coordinates and...
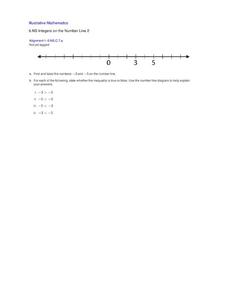
Illustrative Mathematics
Integers on the Number Line 2
Four inequality statements are given for the same two negative numbers. The resource is a good practice for pupils to interpret statements of inequalities relative to the position on the number line. The objective is for pupils to learn...
EngageNY
Rational Numbers on the Number Line
Individuals learn how to plot rational numbers on the number line in the sixth lesson of a 21-part module. They identify appropriate units and determine opposites of rational numbers.
PBS
Plotting Pairs of Coordinate Points in all Four Quadrants to Construct Lines
Here is a lesson on coordinates that has pupils view three Cyberchase video clips illustrating the definition of "point" and "line." Along the way, learners will discuss what characters from the videos do, and where problems lie in their...
Illustrative Mathematics
Electoral College
A cross-curricular resource that takes the electoral votes and allows your learners to organize and analyze the data. Young voters can determine which states are more influential and interpret the dotplot provided for more data....
Arizona Department of Education
Introduction to Integers
Welcome to the backward world of negative numbers. This introductory lesson teaches young mathematicians that negative numbers are simply the opposite of positive numbers as they use number lines to plot and compare single-digit integers.
Balanced Assessment
Who's Left?
If you're not right-handed, are you wrong-handed? Young statisticians calculate the percentage of left-handed people using a given data set in the assessment task. They plot data on a scatter plot and consider how the line of best fit...
Curated OER
Exploring Linear Equations And Scatter Plots - Chapter 5 Review
Students complete rolling stocks experiment, and collect and enter data on the computer. They enter data on graphing calculators, complete scatter plot by hand with line of best fit, and discuss different graphing methods.
Curated OER
Learning to Make Line Graphs
Students analyze data and create a line graph. In this graphing lesson, students explore data from a previous experiment and plot the information on a line graph. Students analyze their findings.
PBS
Plotting Pairs of Coordinate Points in All Four Quadrants to Construct Lines
Your young graphers are motivated by watching three Cyberchase videos to plot points in all four quadrants, connect pairs of points to make a line segment, and find the point of intersection of two lines.
Curated OER
State Names: Frequency
Data grathers determine the frequency of specified data. They identify the frequency that specified letters occur in the names of all 50 states. They create stem-and-leaf plots, box-and-whisket plots and historgrams to illustrate the data.
Curated OER
Plotting Numbers and Test
Sixth graders create a human number line. They determine the correct placement of various numbers ranging from -4 to 4. Additionally, they will determine the placement of numbers written as fractions and/or decimals.
Curated OER
Let's Plot Points
Use coordinate grid paper to plot points and identify shapes that are already plotted on the paper by saying their coordinates. Pupils also measure the distance between points and play the game Battleship. There are several web links and...
Education Development Center
Geography of the Coordinate Plane
Put the graph into graphing and allow learners to understand the concept of point plotting and how it relates to data. The worksheet provides a nice way to connect data analysis to a graph and make predictions. The worksheets within the...
Pennsylvania Department of Education
Equal Groups
Students explore statistics by completing a graphing activity. In this data analysis lesson, students define a list of mathematical vocabulary terms before unpacking a box of raisins. Students utilize the raisins to plot data on a line...
Curated OER
Make a Line Graph
In this make a line graph activity, 6th graders make a line graph for 2 sets of data, using a blank grid, by plotting the numbers, labeling the x and y axes and writing a title.
Jordan-Granite Consortium
Scatter Diagram
You aced the first test, so your score on the second one shouldn't matter, right? Young pupils first draw a best fit line on a provided scatter plot showing test scores for two different tests. They then evaluate five statements on the...
American Statistical Association
EllipSeeIt: Visualizing Strength and Direction of Correlation
Seeing is believing. Given several bivariate data sets, learners make scatter plots using the online SeeIt program to visualize the correlation. To get a more complete picture of the topic, they research their own data set and perform an...
Achieve
BMI Calculations
Obesity is a worldwide concern. Using survey results, learners compare local BMI statistics to celebrity BMI statistics. Scholars create box plots of the data, make observations about the shape and spread of the data, and examine the...
American Statistical Association
Bubble Trouble!
Which fluids make the best bubbles? Pupils experiment with multiple fluids to determine which allows for the largest bubbles before popping. They gather data, analyze it in multiple ways, and answer analysis questions proving they...
EngageNY
Distance on the Coordinate Plane
Scholars learn how to find the distance of vertical and horizontal line segments on the coordinate plane in the 19th installment of a 21-part module. The use of absolute value comes in handy.
Curated OER
Plot Points
In this plotting points worksheet, students solve 6 word problems, plotting sets of points as directed in each problem. Students write ordered pairs, determine "what went wrong" in a problem, and answer reasoning questions.
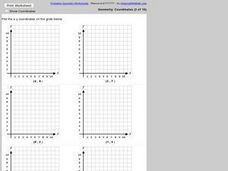
Curated OER
Plotting Coordinates on a Grid
In this plotting points on a graph worksheet, students plot 6 points on 6 graphs. Students plot x and y-coordinates in the first quadrant.
Curated OER
Get a Line on Integers
Young scholars explore number sense by completing math function problems in class. In this integers lesson, students define integers and practice plotting them on a number line. Young scholars utilize math functions such as addition and...
Other popular searches
- Frequency Tables Line Plots
- Line Plots Grade 3
- Math Line Plots
- Christmas Line Plots
- Line Plots and Tallies
- Activities Using Line Plots
- Data Analysis Line Plots
- Human Line Plots
- Ell Math Line Plots
- Line Plots With Airplanes
- Charts, Tables, Line Plots
- Charts Tables Line Plots


