Computer Science Unplugged
Computing: Databases Unplugged
How do databases store and retrieve information? The activities in the resource provide fundamental concepts of databases by introducing an approach that teaches the basics without using computers. The pupils act as the actual data that...
Curated OER
Kinzi Deaf Alumni
Learners use data of school alumni to create a database. The lesson plan uses technology and access to a computer lab is essential. The concepts of graphing statistics is also used to help teach across the curriculum.
NASA
The Case of the Wacky Water Cycle
Join the tree house detectives in learning about the processes of the water cycle, water conservation, water treatment, and water as a limited resource.
Curated OER
Get Ready For Some Football
Sixth graders compare and contrast the totals from two national football teams for the year. Using the internet, they search for the information they need and create a data bar graph. They use the information they collected to answer...
Curated OER
Fantasy Baseball Team
Students create a database and use its ability to store, sort, and present information about their fantasy baseball team. They gather information and use their knowledge of statistics to accomplish their team.
Curated OER
Database Lesson
Students access the Internet to locate data regarding their assigned mathematician. They organize their notes onto a data form, then enter it into a database, and sort the database according to given criteria.
Curated OER
Sweet Data
Students input data about the colors of their serving of M&M candies onto a spreadsheet. They create charts and graphs based on this information.
Curated OER
Space: The Final Frontier
Sixth graders construct a graph to demonstration information that they've learned about the solary system. They also write or illustrate a sonar or lunar eclipse.
Curated OER
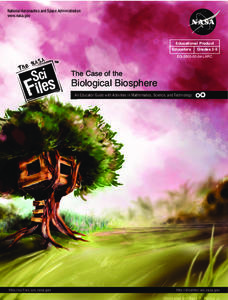
The Case of the Biological Biosphere: Health, Math, Technology
Students investigate various aspects of the human body in this imaginative Tree House Detective episode about the biological biosphere. In a series of They take measurements, analyze data, and use technology. The lessons revolve around...
Curated OER
Types of Data
In this data chart activity, students read the directions and study the examples to learn the difference between qualitative, quantitative, discrete and continuous data. Students answer 24 questions. This page is intended to be an online...
Curated OER
Size Small School
Students explore the concept of scale and ratio. In this scale and ratio instructional activity, students work in groups to measure a given space such as a hallway, office, or gym. Students measure their area using a meter stick. ...
Curated OER
Understanding Fractions
Students add and subtract fractions and multiply and divide fractions using pattern blocks.
Curated OER
Botanical Discoveries
Sixth graders examine the Lewis and Clark Expedition. For this plant discovery lesson, 6th graders put in chronological order the plant discoveries of Lewis and Clark. Students understand the characteristics of leaves and find the area...
Curated OER
Birds, Fractions and Percentages
Students study fractions, percentages, spreadsheets, and computers by watching and recording the number of species of birdsseen. They create a spreadsheet to record the results of their one month study.
Curated OER
Pumped Up Gas Prices
Students spend one month keeping track of the mileage and gasoline amounts they or their family has used. Information is entered into a spreadsheet to help calculate the average gas prices over time.
Curated OER
The Hot Dog Stand - An Annual Report
Middle schoolers run a computer simulation and collect data as they work and use the data to create an annual report for their business. It is desirable for students to do this project individually, but it could be done as a class using...
Curated OER
Toy Planet
Students design a toy store, supply it with merchandise (on paper) and create advertisements. They also manage the store's debits and credits by using a spreadsheet. They consider how to promote the sale of their merchandise.


